


App herunterladen
-
- Handelsplattformen
- PU Prime App
- MetaTrader 5
- MetaTrader 4
- PU Copy Trading
- Web-Händler
- PU Soziales


DE
App herunterladen
13 Juni 2023,06:06
Tägliche Marktanalyse
13 Juni 2023, 06:06


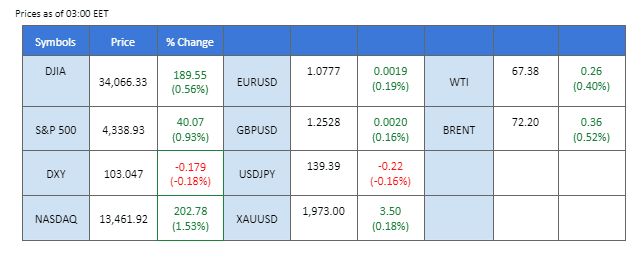
The U.S. equity market witnessed a notable rally as investors expressed optimism about the possibility of the Federal Reserve pausing the rate hike, with the decision scheduled to be announced on Wednesday, June 14th. Prominent companies such as Apple Inc., Nvidia, and Tesla, among others, experienced bullish momentum as investors eagerly embraced technology-related stocks. Additionally, market participants are closely monitoring the release of the CPI reading later today, as it could provide insights into the inflationary trends in the U.S. If the data indicates a cooling down of inflation, it is likely to increase the likelihood of the Fed pausing the current round of rate hikes. All eyes are focused on these developments, shaping market sentiment and influencing investor decisions.
Aktuelle Wetten auf eine Zinserhöhung 14. Juni Zinsentscheidung der Fed:
Quelle: CME Fedwatch Tool
0 bps (76%) VS 25 bps (24%)
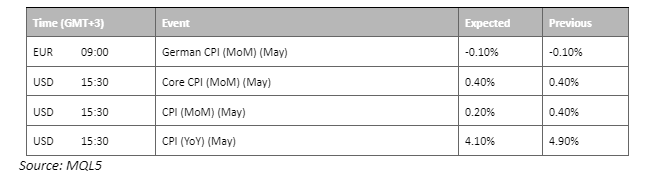
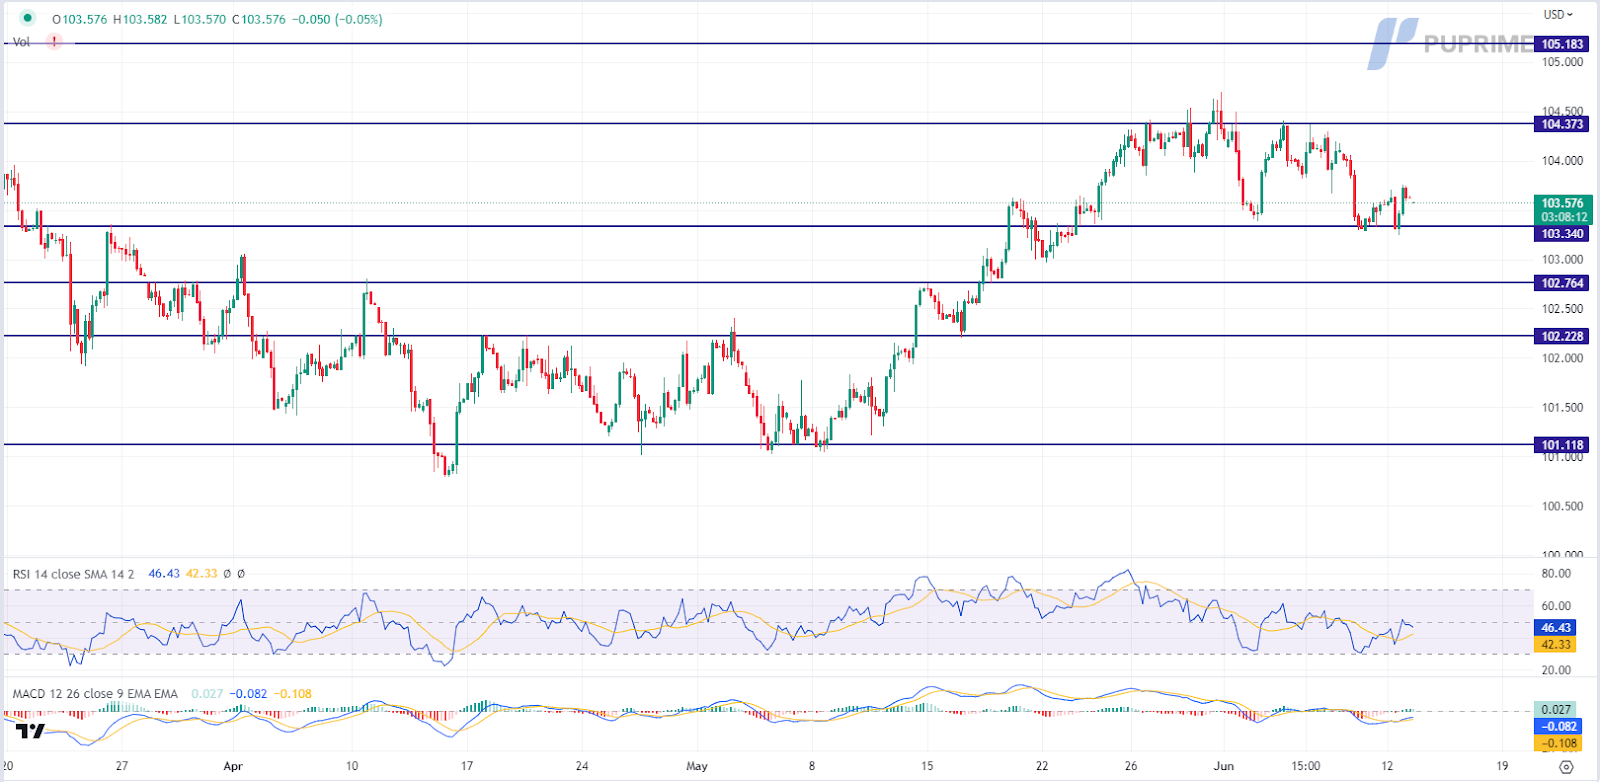
The US dollar remained steady, trading within a consolidated range, as market participants eagerly awaited the Federal Open Market Committee (FOMC) meeting. The focus shifted towards the Federal Reserve’s interest rate decision, with widespread expectations that the central bank will take a breather in its prolonged tightening cycle. According to the CME FedWatch tool, investors assigned a 76% probability to the Fed pausing its interest rates, which currently stand at 5% – 5.25%.
The dollar index is trading lower while currently testing the support level. However, MACD has illustrated diminishing bearish momentum, while RSI is at 46, suggesting the index might be traded higher as technical correction since the RSI rebounded sharply from oversold territory.
Resistance level: 104.35, 105.20
Support level: 103.50, 102.75
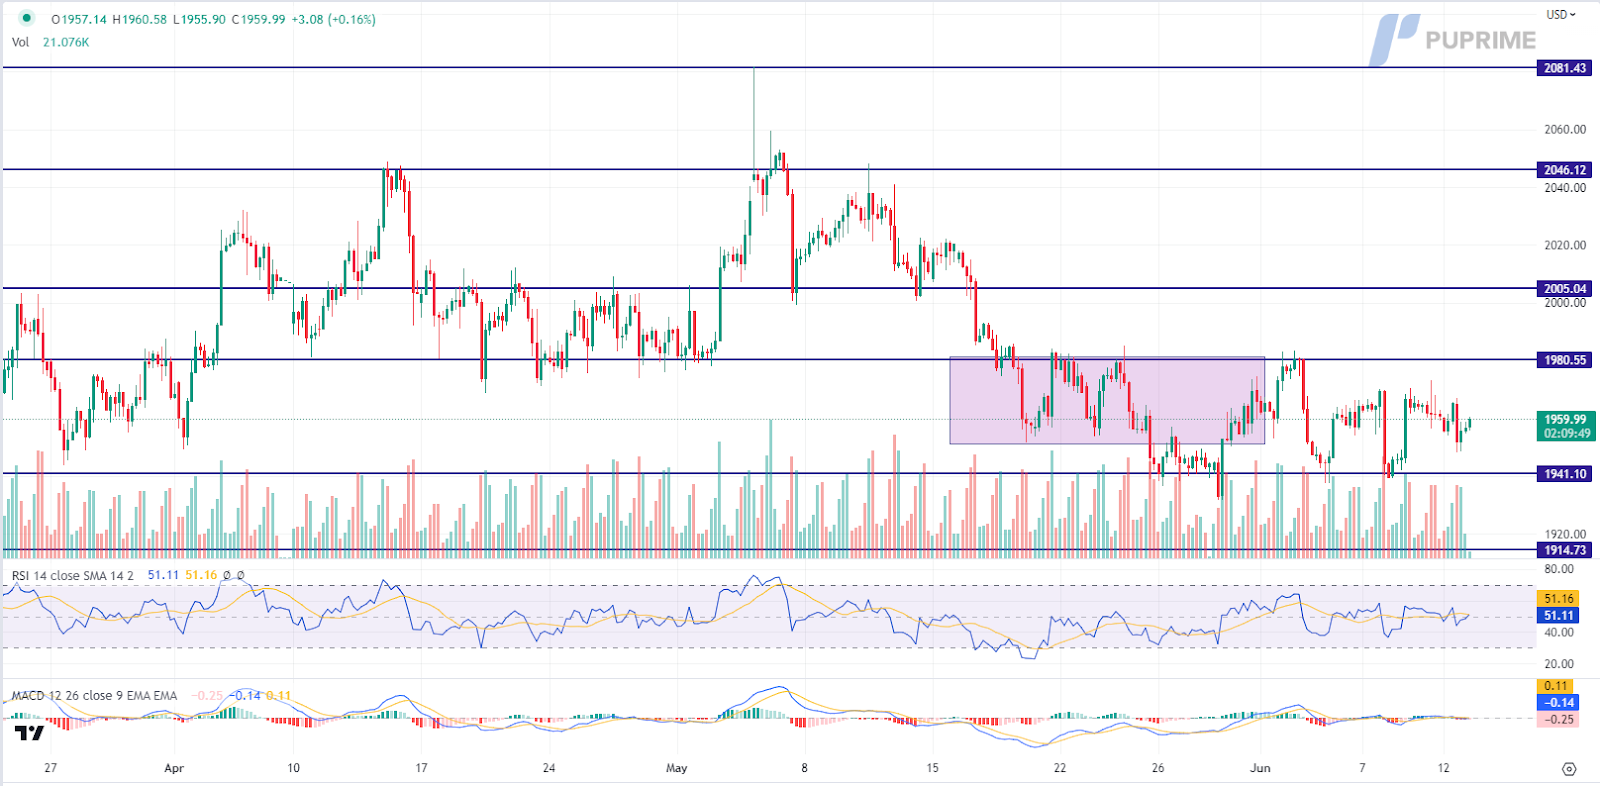
Gold prices remained within a consolidated range as market participants eagerly awaited the Federal Open Market Committee (FOMC) interest rate decision and the release of the US Consumer Price Index (CPI) data tonight. Amidst the anticipation, investors remain vigilant, closely monitoring these significant events to assess the potential impact on the precious metal. The outcome of the FOMC decision and the CPI figures will provide critical insights into the future direction of gold, guiding market sentiment and shaping investors’ perception of the commodity’s movement in the near term.
Gold prices are trading flat between the support and resistance level. However, MACD has illustrated diminishing bearish momentum, while RSI is at 51, suggesting the commodity might trade higher in short-term as the RSI stays above the midline.
Widerstandsniveau: 1980,00, 2005,00
Unterstützungsniveau: 1940,00, 1915,00

The Euro staged a modest recovery since it touched its recent low at 1.0660. Although the ECB always signalled for a hawkish monetary policy; however, investors firmly believe that the ECB will only raise 25 bps to its interest rate this round. On the other hand, the much anticipated U.S. CPI may have a big impact on the pair. The market is still uncertain if the Fed may pause its rate hike this round; however, a softer CPI may encourage the Fed to pause its rate hike and may weaken the dollar as a result.
EUR/USD is trading higher while currently near the resistance level. The RSI keeps hovering above 50-level suggesting the buying power is prevailing the selling power. The MACD, however flowing flat suggests the bullish momentum is diminishing.
Resistance level: 1.0842, 1.0921
Support level: 1.0665, 1.0585
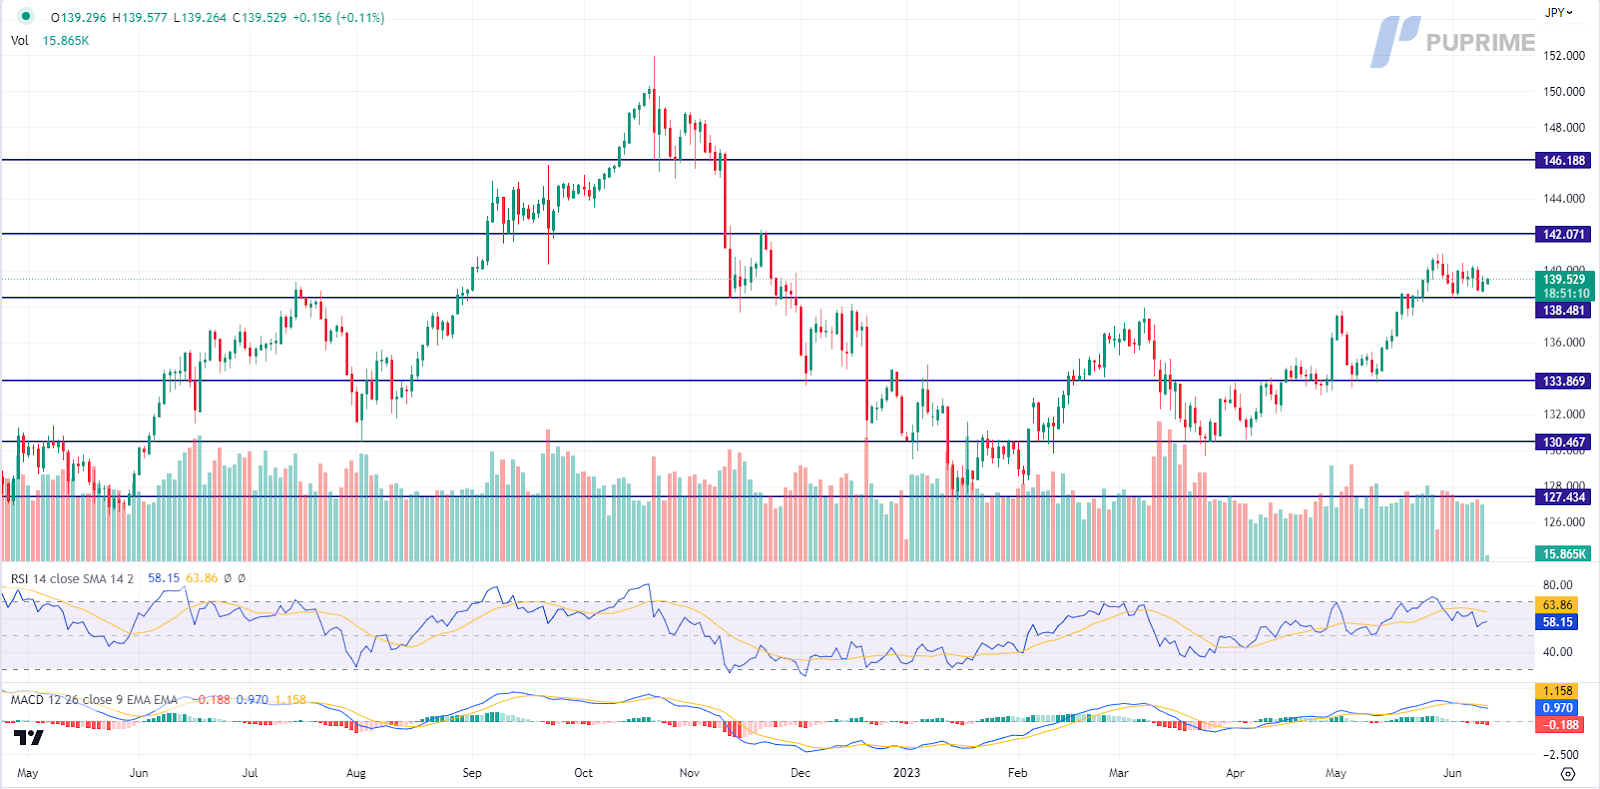
The yield curve divergence between Japan and the United States continues to expand, resulting in the USD/JPY currency pair consolidating within a higher range. Market participants are closely monitoring the upcoming monetary policy decisions from the Federal Reserve and the Bank of Japan this week. While the Fed is expected to maintain interest rates, their overall tone and outlook will be pivotal in shaping market sentiment. Meanwhile, the Bank of Japan is anticipated to uphold its accommodative stance, emphasising the significance of sustained wage growth and providing long-term support for inflation and the overall economy. These crucial policy decisions, combined with key economic indicators, will play a significant role in determining the short-term trajectory of the USD/JPY exchange rate.
USD/JPY is trading flat while currently near the support level. MACD has illustrated increasing bearish momentum, while RSI is at 57, suggesting the pair might extend its losses after breakout since the RSI retraced sharply from the overbought territory.
Widerstandsniveau: 142,05, 146,20
Unterstützungsniveau: 138,50, 133,85
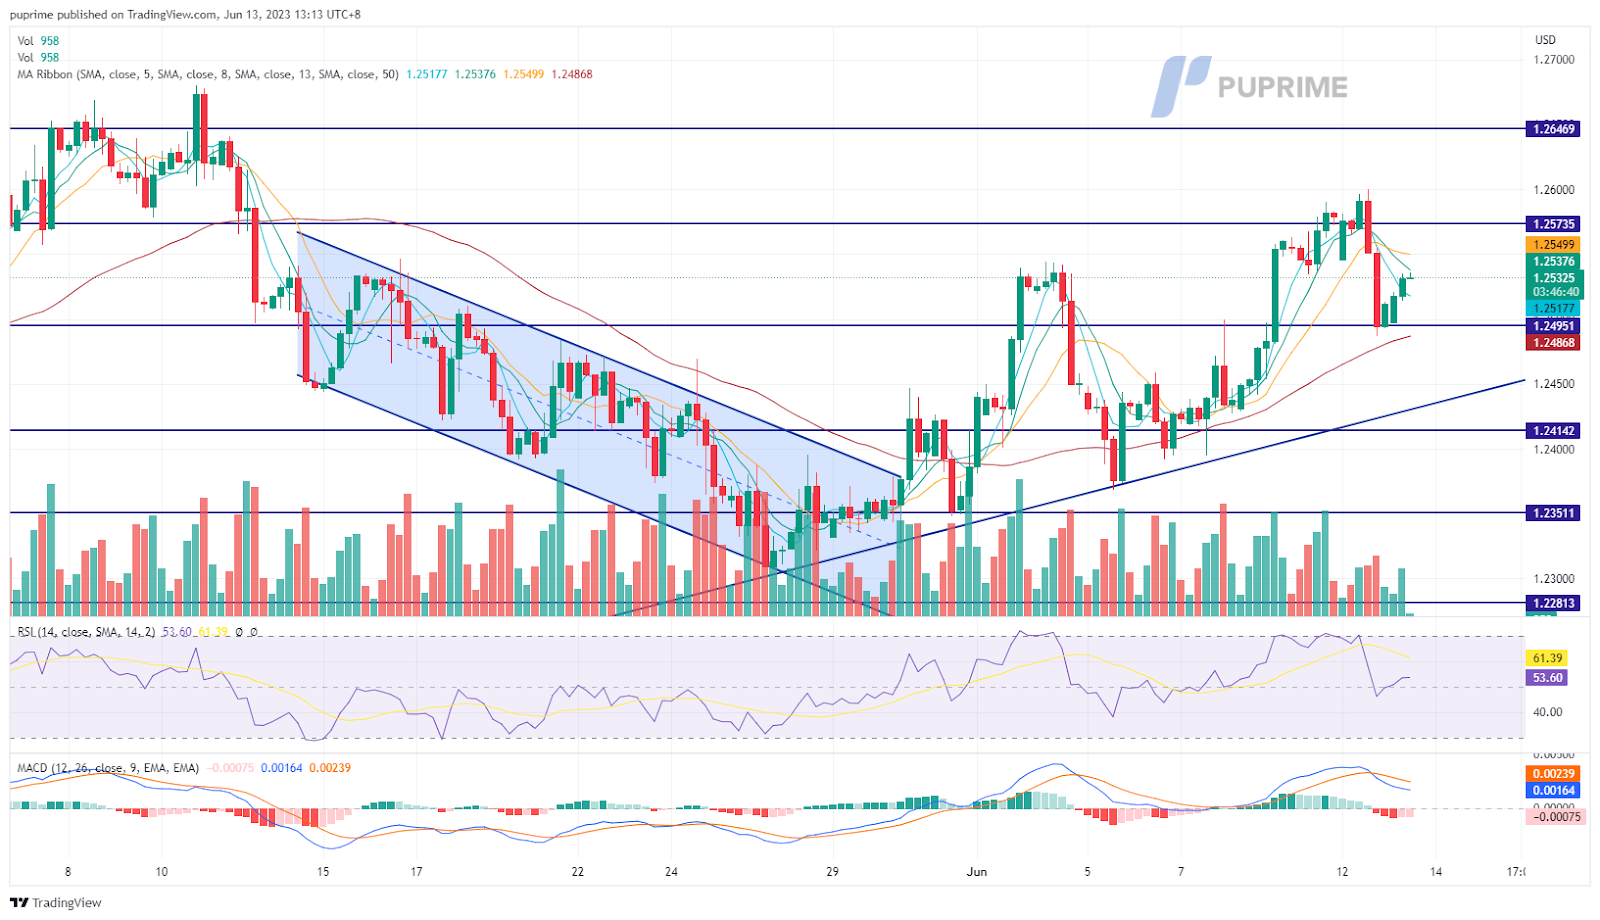
The Sterling recorded a drop last night but is still trading on its uptrend support level. Sterling gained as the BoE showed a Hawkish stance while the Fed appeared to be more dovish, especially after the debt ceiling woes. Given the market is uncertain of what monetary policy the Fed will deliver tomorrow, investors can refer to the CPI that is going to be released later today to gauge the Fed’s next move. Meanwhile, investors may also refer to the UK’s GDP to gauge the BoE’s monetary policy that will be announced next week.
The cable has a technical retracement after hitting its recent high at 1.2599. the RSI has declined before getting into the overbought zone while the MACD has eased from the above suggesting the bullish momentum for the cable has eased at the moment.
Resistance level: 1.2570, 1.2650
Support level: 1.2495, 1.2414
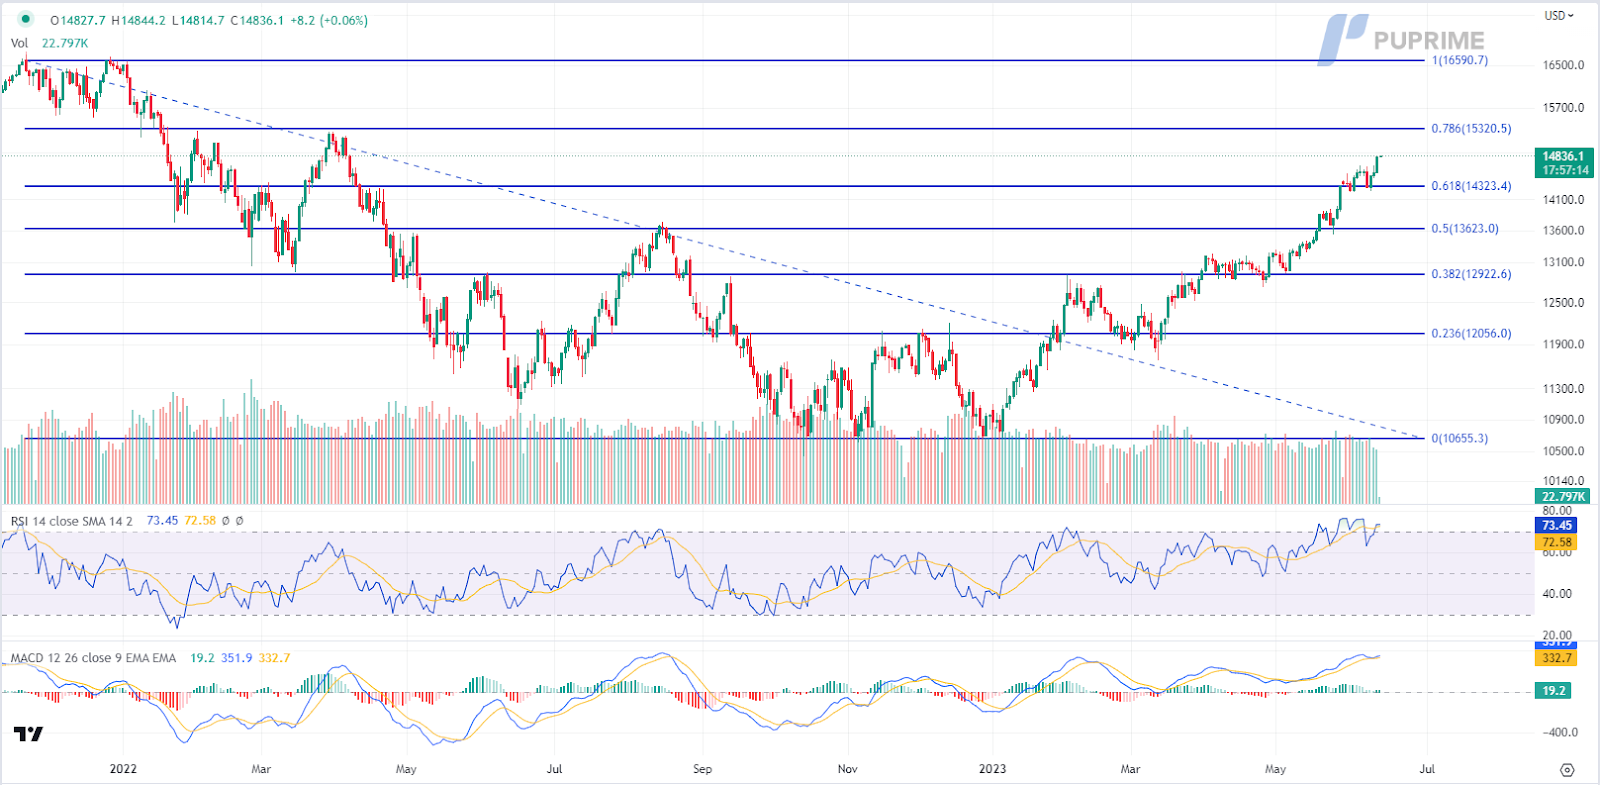
The US equity market, led by the Nasdaq, soared to their highest closing levels since April 2022 on Monday. With the highly anticipated US inflation data and the Federal Reserve’s interest rate decision looming, investors displayed resilience and optimism. Tech stocks, particularly high-growth giants like Amazon, Apple, and Tesla, propelled the bullish momentum, bolstering market sentiment.
Nasdaq is trading higher following the prior breakout above the previous resistance level. MACD has illustrated increasing bullish momentum. However, RSI is at 73, suggesting the index might enter overbought territory.
Resistance level: 15320.00, 16590.0.
Support level: 14325.0, 13625.0
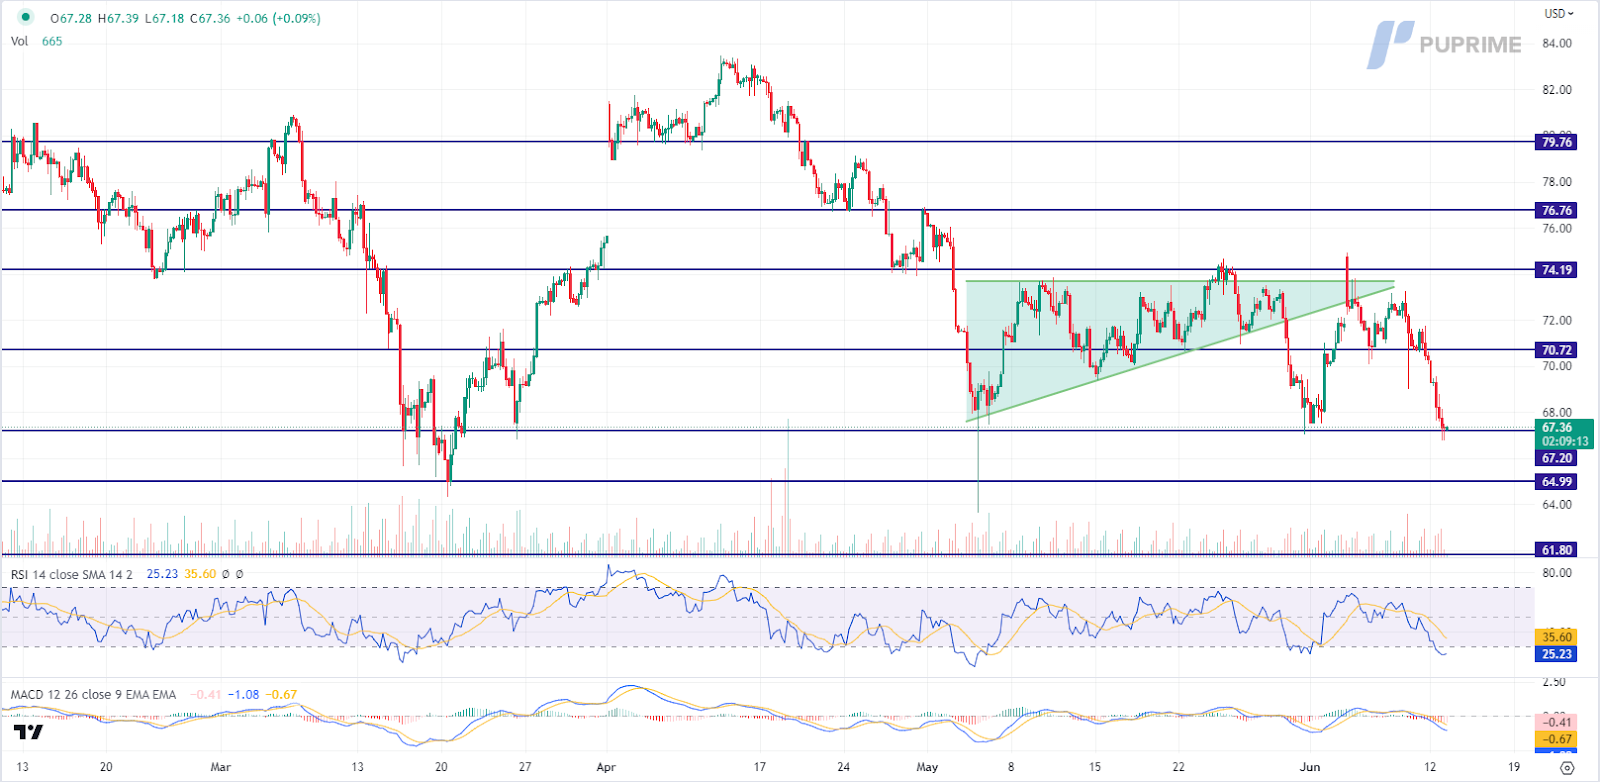
Oil prices tumbled on Monday due to mounting worries about global supply levels and lacklustre demand recovery in China, the world’s leading importer of crude oil and refined products. Adding to the downward pressure, analysts raised concerns ahead of key inflation data and the upcoming US Federal Reserve meeting. Goldman Sachs’ downward revision of oil price forecasts further contributed to market uncertainties.
Oil prices are trading lower following the prior breakout below the previous support level. However, MACD has illustrated diminishing bearish momentum, while RSI is at 25, suggesting the commodity might enter oversold territory.
Widerstandsniveau: 70,70, 74,20
Unterstützungsniveau: 67,20, 65,00

Handeln Sie Forex, Indizes, Metalle und mehr zu branchenweit niedrigen Spreads und mit blitzschneller Ausführung.
Registrieren Sie sich für ein PU Prime Live-Konto mit unserem unkomplizierten Verfahren
Zahlen Sie bequem über verschiedene Kanäle und in verschiedenen Währungen auf Ihr Konto ein
Erhalten Sie Zugang zu Hunderten von Instrumenten zu marktführenden Handelsbedingungen
Handelsplattformen
Lernen
Über PU Prime
Unternehmen

Bitte beachten Sie, dass die Website für Personen bestimmt ist, die in Ländern ansässig sind, in denen der Zugriff auf die Website gesetzlich zulässig ist.
Bitte beachten Sie, dass PU Prime und die mit ihr verbundenen Unternehmen nicht in Ihrem Heimatland ansässig oder tätig sind.
Indem Sie auf die Schaltfläche "Bestätigen" klicken, bestätigen Sie, dass Sie diese Website ausschließlich aus eigener Initiative und nicht als Ergebnis einer speziellen Marketingaktion besuchen. Sie möchten Informationen von dieser Website erhalten, die auf umgekehrte Weise in Übereinstimmung mit den Gesetzen Ihres Heimatlandes zur Verfügung gestellt werden.
Vielen Dank für Ihre Rückmeldung!
Beachten Sie, dass die Website für Personen bestimmt ist, die in Rechtsgebieten wohnen, in denen der Zugang zur Website nach dem Gesetz erlaubt ist.
Beachten Sie, dass PU Prime und seine Tochtergesellschaften nicht in Ihrem Heimatland ansässig sind und nicht in Ihrem Land arbeiten.
Al hacer clic en el botón "Aceptar", confirmas que estás ingresando a este sitio web por tu propia iniciativa y no como resultado de ningún esfuerzo de marketing específico. Deseas obtener información de este sitio web que se proporciona mediante solicitud inversa de acuerdo con las leyes de tu jurisdicción de origen.
Vielen Dank für Ihre Rückmeldung!