


App herunterladen
-
- Handelsplattformen
- PU Prime App
- MetaTrader 5
- MetaTrader 4
- PU Copy Trading
- Web-Händler
- PU Soziales


DE
App herunterladen
28 November 2023,08:55
Tägliche Marktanalyse
28 November 2023, 08:55


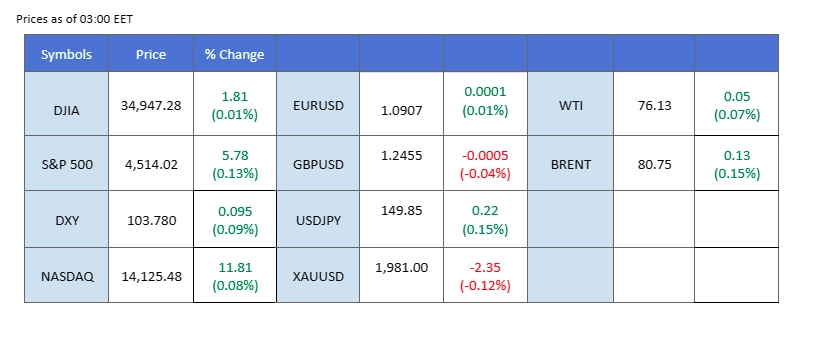
Recent downbeat economic data from the U.S., which indicates a moderation in economic performance and contained inflation, has led the market to believe that the Federal Reserve is on the verge of concluding its tightening cycle. This speculation has buoyed equity markets, with the Nikkei reaching its highest level since 1990. Investors eagerly await Nvidia’s earnings report scheduled for Tuesday, anticipating a potential tech rally in the U.S. equity market. Conversely, oil prices experienced a nearly 4% gain last Friday in anticipation of the upcoming OPEC meeting, with market expectations centred around further cuts to oil supplies by the cartel to stabilise prices in 2024..
Aktuelle Wetten auf eine Zinserhöhung 13. Dezember Zinsentscheidung der Fed:
Quelle: CME Fedwatch Tool
0 bps (95,0%) VS 25 bps (5%)
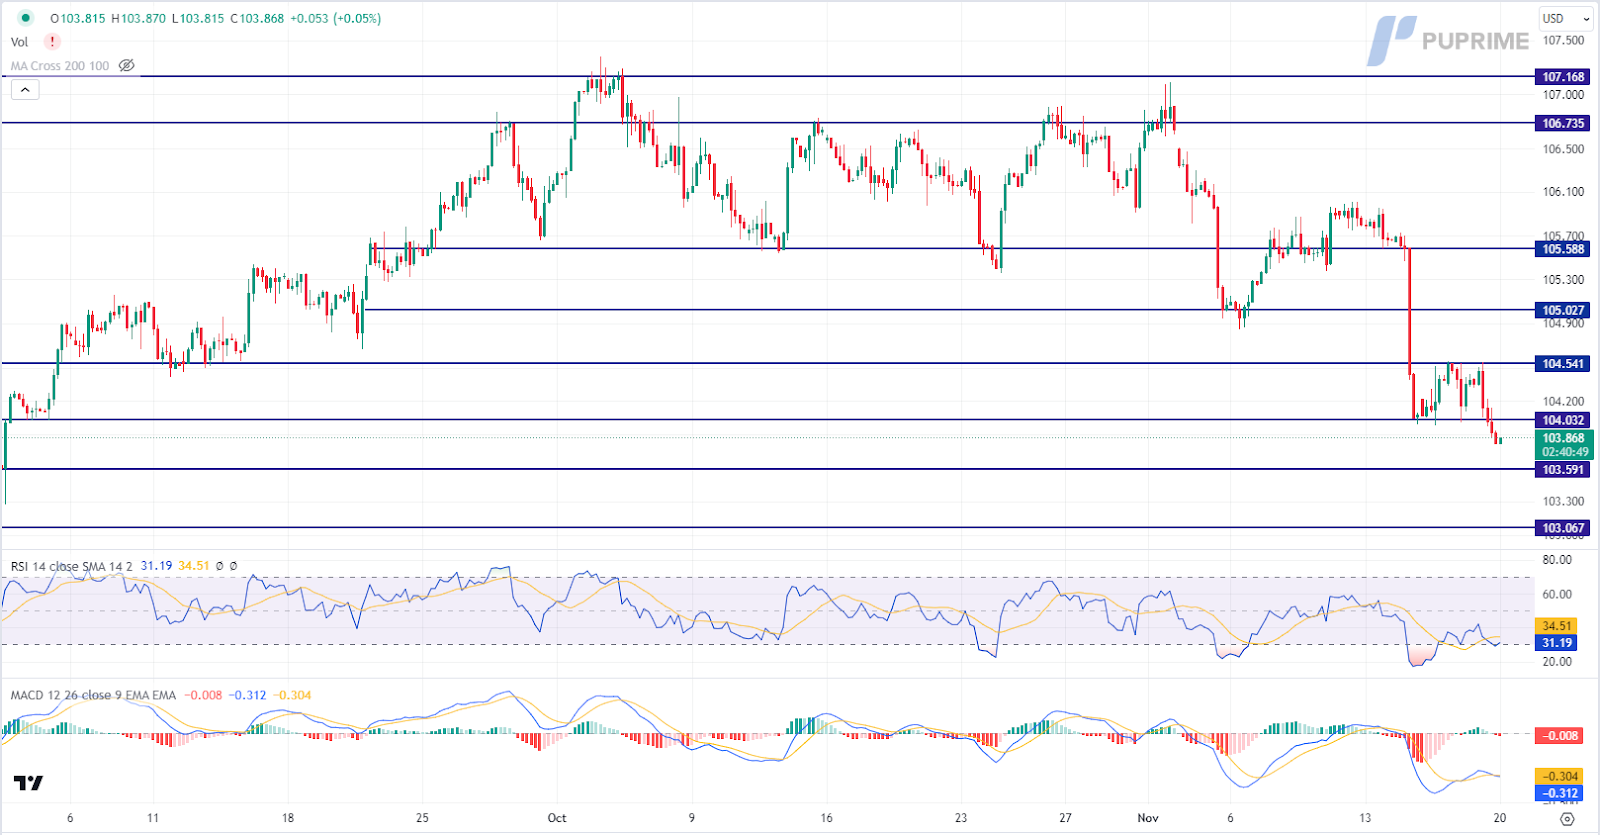
The US Dollar experiences a decline as investors brace for the release of the Federal Open Market Committee (FOMC) meeting minutes, seeking fresh insights into the future trajectory of interest rates. The Federal Reserve’s decision to publish the minutes earlier, on Tuesday, ahead of the Thanksgiving holiday, heightens anticipation. Recent US economic data indicating a cooling inflation rate fuels speculation that the Federal Reserve might consider winding down its tightening monetary measures. Investors keenly comb through the minutes, searching for cues on policymakers’ inclinations in response to evolving economic conditions.
The Dollar Index is trading lower following the prior breakout below the previous support level. However, MACD has illustrated diminishing bearish momentum, while RSI is at 31, suggesting the index might enter oversold territory.
Resistance level: 104.05, 104.55
Support level: 103.60, 103.05

Gold prices exhibit a slight retreat during the early Asian financial market open, attributed to profit-taking by investors ahead of the FOMC meeting minutes. Heightened market volatilities are anticipated, with the potential for aggressive monetary policy statements in the minutes to influence movements in US Treasury yields and the US Dollar. Investors strategically position themselves, closely monitoring the upcoming minutes event for nuanced signals that may shape the precious metal’s trajectory.
Gold prices are trading lower following the prior retracement from the resistance level. MACD has illustrated diminishing bullish momentum, while RSI is at 58, suggesting the commodity might extend its losses toward support level since the RSI retreated sharply from overbought territory.
Resistance level: 1985.00, 2005.00
Support level: 1965.00, 1940.00
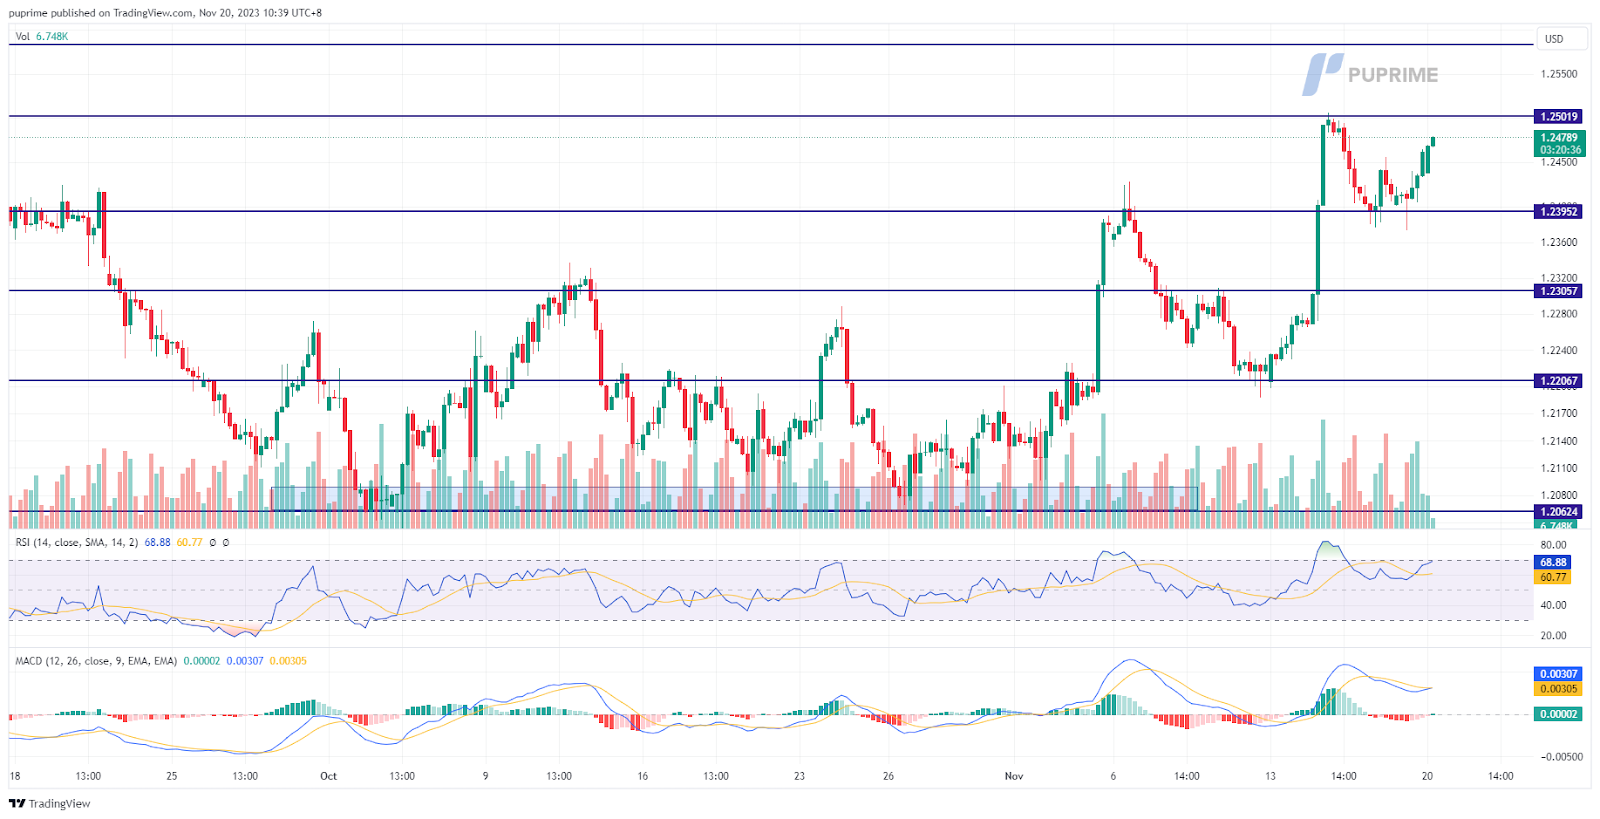
Last Friday’s UK Retail Sales data fell short of market expectations and showed a contraction, which exerted downward pressure on the Cable, limiting its upward movement. However, recent downbeat economic data from the U.S. has fueled speculation in the market that the Federal Reserve has reached the peak of its interest rate cycle. This sentiment has resulted in the dollar losing strength, providing some support for Sterling.
The Cable rebounded at its short-term support level at 1.2400, suggesting a bullish signal for the Cable. Both the RSI and MACD stayed elevated, suggesting the bullish momentum is still strong.
Resistance level: 1.2501, 1.2590
Support level: 1.2306, 1.2207
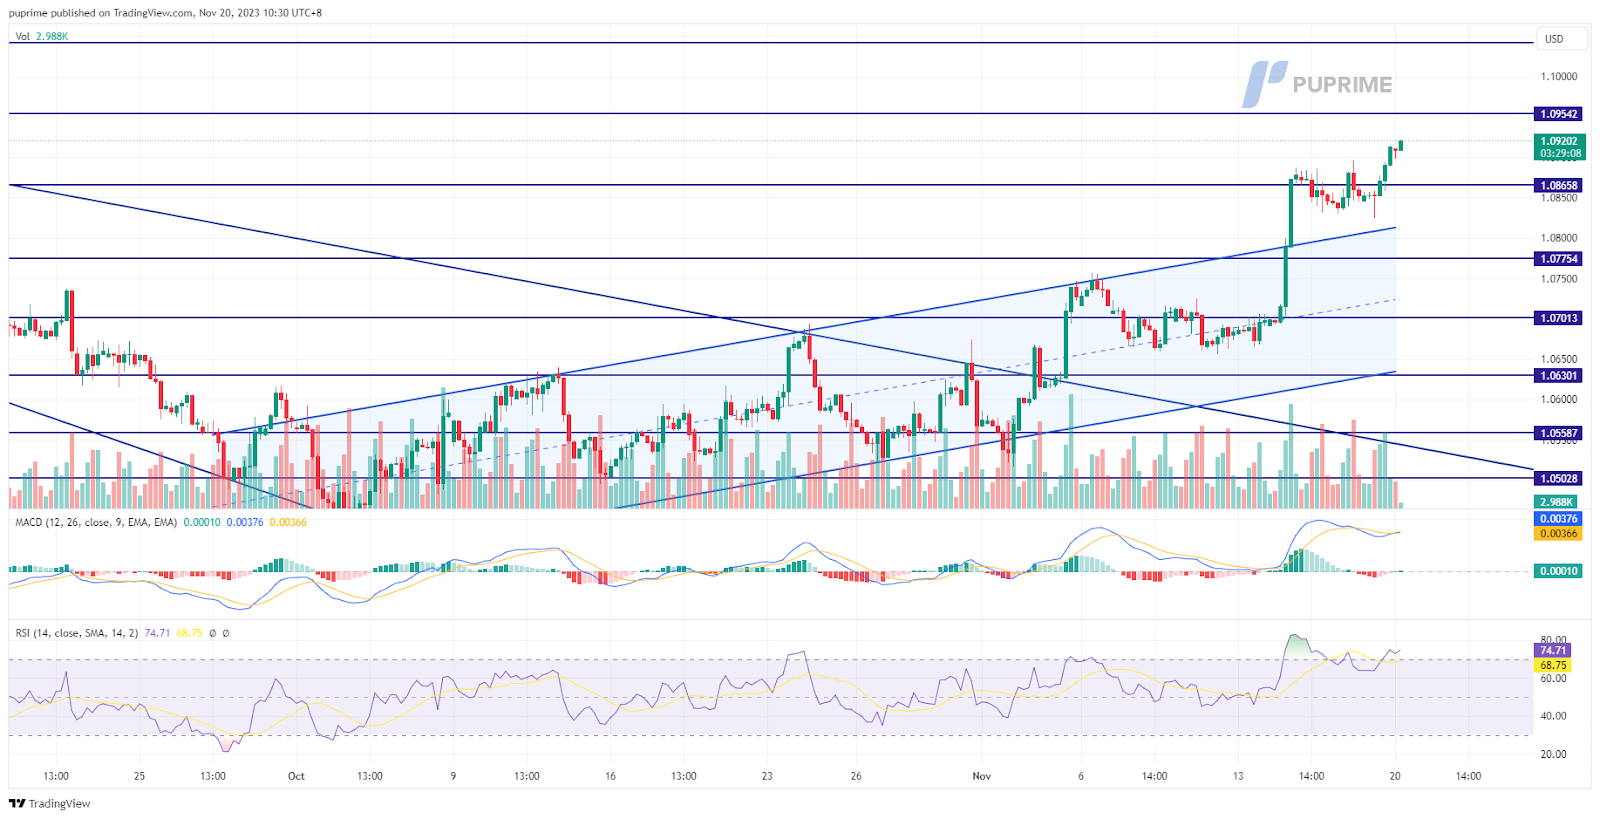
The EUR/USD is on an upward trajectory after breaking above its uptrend channel, indicating a bullish trend for the pair. Eurozone’s CPI reading last Friday met market expectations, showing a decrease from the previous reading and suggesting easing inflation. However, recent downbeat economic data from the U.S. has fueled market beliefs that the Federal Reserve has reached the peak of its interest rate cycle. This sentiment has continued to exert downward pressure on the dollar, supporting the EUR/USD pair in its upward movement.
The EUR/USD pair remained elevated after it broke above its uptrend channel. The RSI is hovering near the overbought zone while the MACD is about to cross above the zero line and continue to move upward, suggesting the bullish momentum remains strong with the pair.
Resistance level:1.0950, 1.1040
Support level: 1.0780, 1.0700
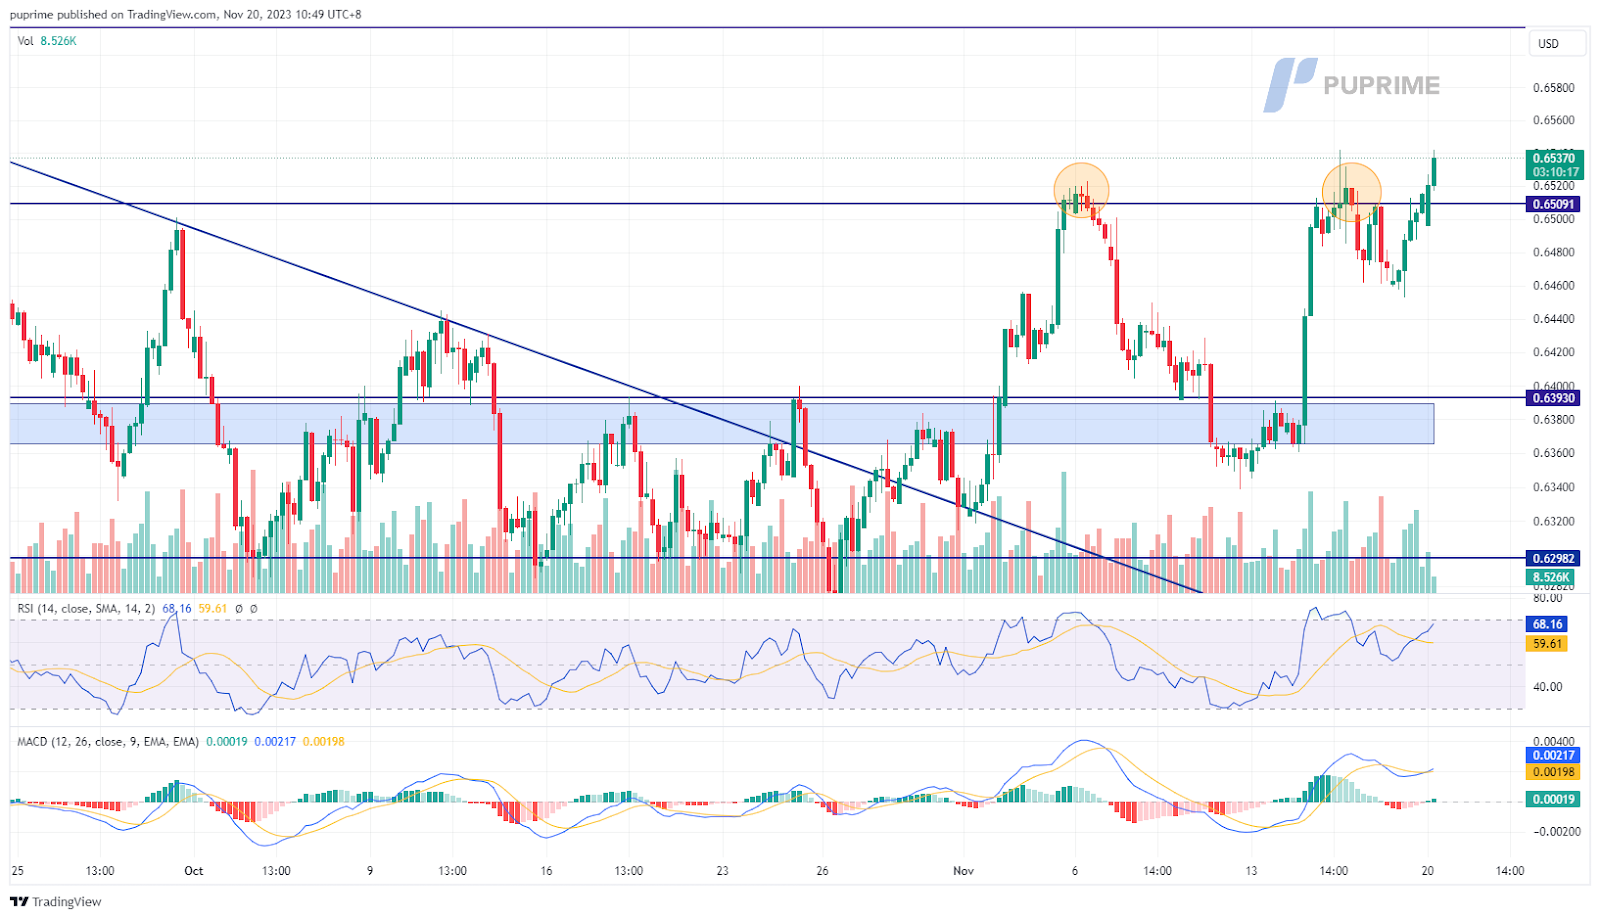
The Aussie dollar successfully surpassed its formidable resistance at 0.6510, signalling a bullish trend for the pair. Ongoing downward pressure on the U.S. dollar, fueled by market beliefs that interest rates in the U.S. have peaked, has contributed to this breakout. Additionally, AUD/USD traders are eagerly anticipating the release of the RBA meeting minutes tomorrow, seeking insights into the RBA’s future monetary policy decisions.
The AUD/USD was reluctant to form a triple-top price pattern and broke above its strong resistance level, suggesting a strong bullish signal for the pair. The RSI remains elevated while the MACD continues to flow above the zero line suggesting a strong bullish momentum.
Resistance level:0.6616, 0.6710
Support level: 0.6510, 0.6390
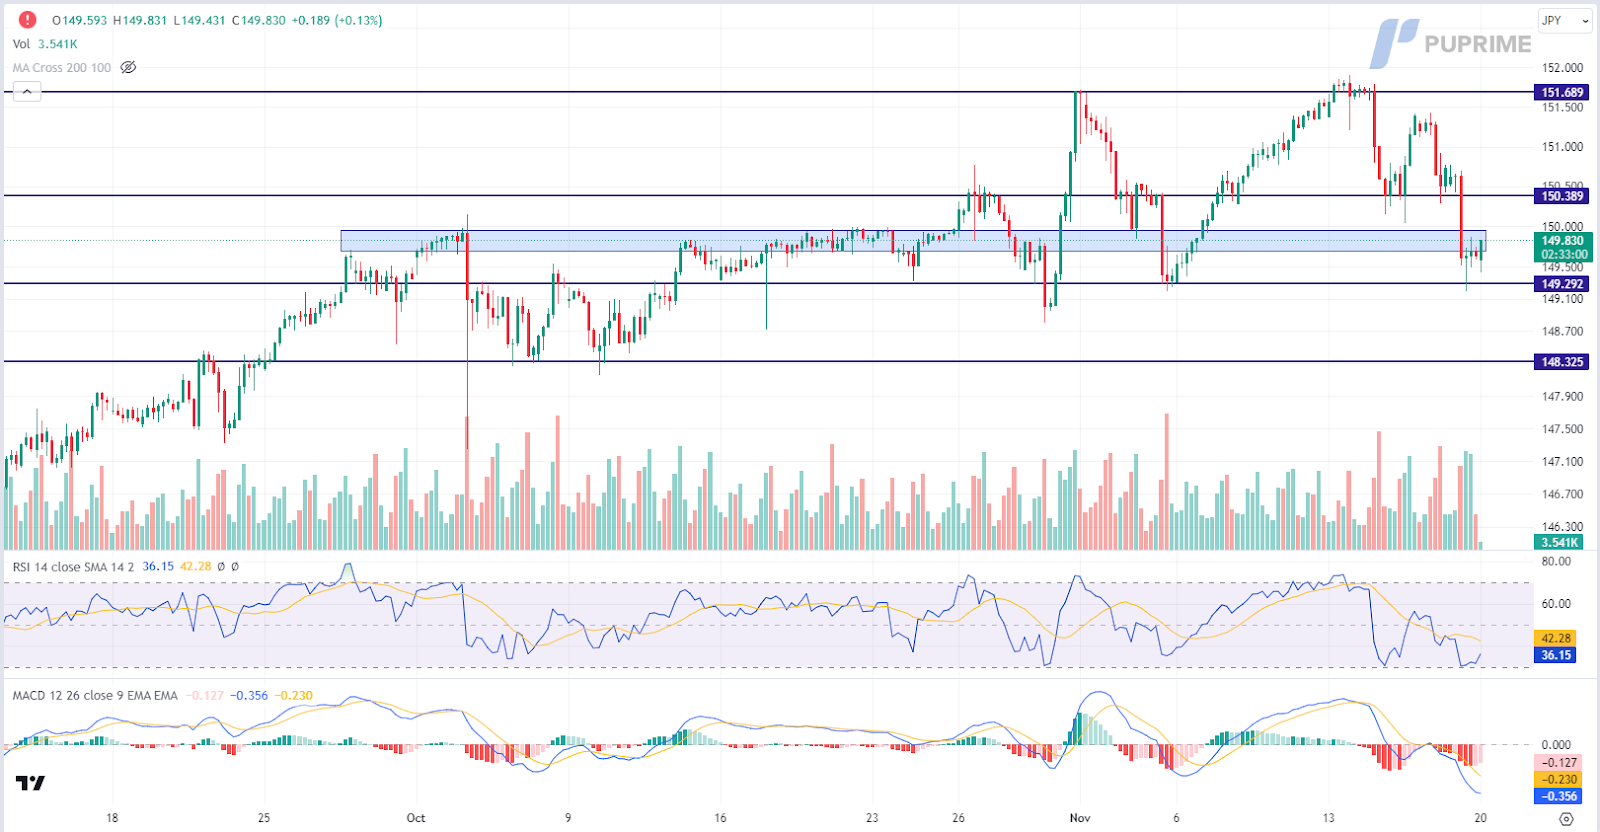
The USD/JPY pair experiences a sharp retreat, breaching the critical support level of 150.00. Plummeting US Treasury yields, coupled with a weakening US Dollar, contribute to the downward pressure on the currency pairing. The tightening of US-Japan interest rate differentials adds to the bearish sentiment, fueled by investor expectations that the Federal Reserve might pivot away from its tightening monetary policy, particularly in the wake of recent disappointing economic data.
USD/JPY is trading lower while currently testing the support level. However, MACD has illustrated diminishing bearish momentum, while RSI is at 36, suggesting the pair might enter oversold territory.
Resistance level: 150.40, 151.70
Support level: 149.30, 148.35
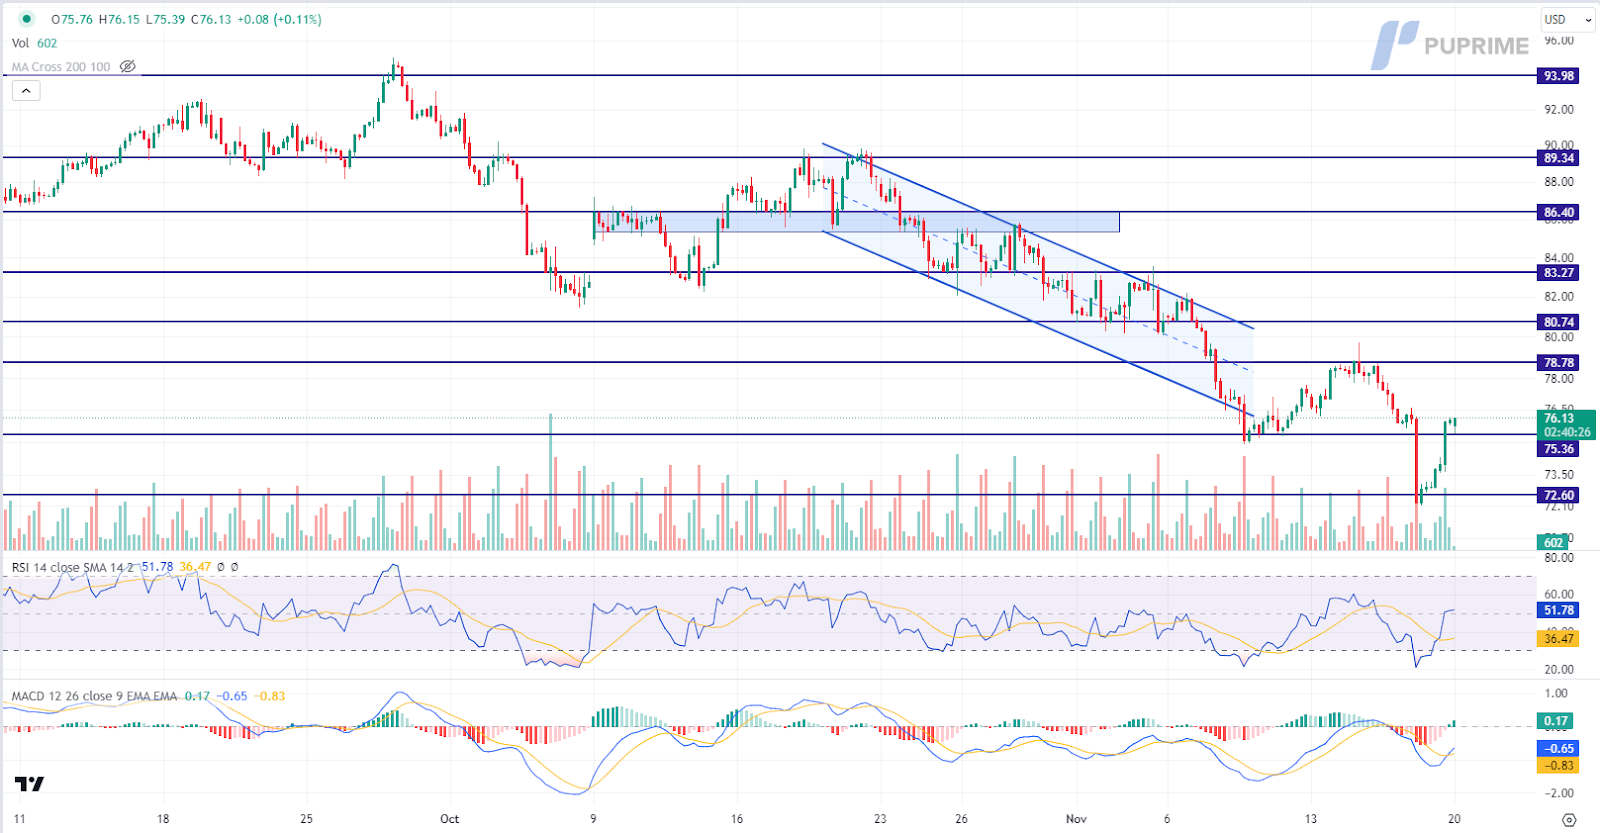
Oil prices undergo a significant jump, rebounding from a four-month low in the preceding session. Short covering by investors who had taken bearish positions, combined with US sanctions on certain Russian oil shippers, supports the overall oil market. The US sanctions, targeting maritime companies and vessels involved in shipping Russian oil above the Group of Seven’s price cap, prompt speculation about potential disruptions in Russian oil shipments.
Oil prices are trading higher following the prior breakout above the previous resistance level. MACD has illustrated increasing bullish momentum, while RSI is at 52, suggesting the commodity might extend its gains since the RSI stays above the midline.
Widerstandsniveau: 78,80, 80,75
Unterstützungsniveau: 75,35, 72,60

Handeln Sie Forex, Indizes, Metalle und mehr zu branchenweit niedrigen Spreads und mit blitzschneller Ausführung.
Registrieren Sie sich für ein PU Prime Live-Konto mit unserem unkomplizierten Verfahren
Zahlen Sie bequem über verschiedene Kanäle und in verschiedenen Währungen auf Ihr Konto ein
Erhalten Sie Zugang zu Hunderten von Instrumenten zu marktführenden Handelsbedingungen
Handelsplattformen
Lernen
Über PU Prime
Unternehmen

Bitte beachten Sie, dass die Website für Personen bestimmt ist, die in Ländern ansässig sind, in denen der Zugriff auf die Website gesetzlich zulässig ist.
Bitte beachten Sie, dass PU Prime und die mit ihr verbundenen Unternehmen nicht in Ihrem Heimatland ansässig oder tätig sind.
Indem Sie auf die Schaltfläche "Bestätigen" klicken, bestätigen Sie, dass Sie diese Website ausschließlich aus eigener Initiative und nicht als Ergebnis einer speziellen Marketingaktion besuchen. Sie möchten Informationen von dieser Website erhalten, die auf umgekehrte Weise in Übereinstimmung mit den Gesetzen Ihres Heimatlandes zur Verfügung gestellt werden.
Vielen Dank für Ihre Rückmeldung!
Beachten Sie, dass die Website für Personen bestimmt ist, die in Rechtsgebieten wohnen, in denen der Zugang zur Website nach dem Gesetz erlaubt ist.
Beachten Sie, dass PU Prime und seine Tochtergesellschaften nicht in Ihrem Heimatland ansässig sind und nicht in Ihrem Land arbeiten.
Al hacer clic en el botón "Aceptar", confirmas que estás ingresando a este sitio web por tu propia iniciativa y no como resultado de ningún esfuerzo de marketing específico. Deseas obtener información de este sitio web que se proporciona mediante solicitud inversa de acuerdo con las leyes de tu jurisdicción de origen.
Vielen Dank für Ihre Rückmeldung!