


App herunterladen
-
- Handelsplattformen
- PU Prime App
- MetaTrader 5
- MetaTrader 4
- PU Copy Trading
- Web-Händler
- PU Soziales


DE
App herunterladen
12 März 2024,05:49
Tägliche Marktanalyse
12 März 2024, 05:49


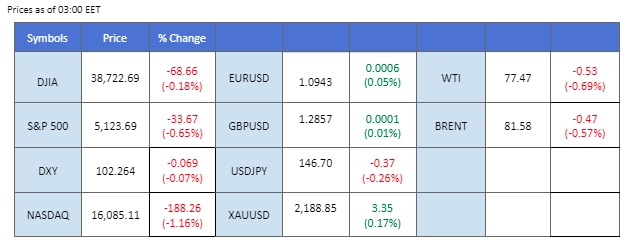
The US Dollar faces challenges as key employment indicators present a mixed picture, with a disappointing unemployment rate and hourly earnings figures contrasting with a robust non-farm payroll report. The US Unemployment rate and Average Hourly Earnings came in at 3.90% and 0.10%, respectively, both worse than the expected 3.70% and 0.2%. However, the US Nonfarm Payrolls showed significant improvement, rising from 229K to 275K, surpassing the market expectations of 198K. Gold prices are on the rise due to a weakening dollar and expectations of Fed interest rate cuts. Meanwhile, Crude oil experiences a slight dip amid concerns over soft Chinese demand and a conservative economic growth target, with attention shifting to potential rate cuts by major central banks to stimulate oil demand and foster economic growth.
Aktuelle Wetten auf eine Zinserhöhung 20. März Zinsentscheidung der Fed:
Quelle: CME Fedwatch Tool
0 bps (95%) VS -25 bps (5%)
(MT4 Systemzeit)
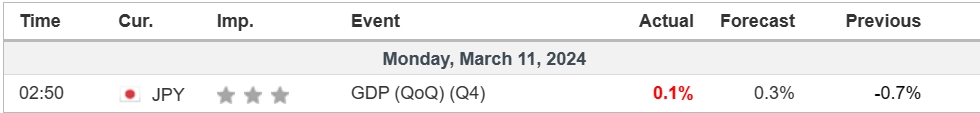
Quelle: MQL5
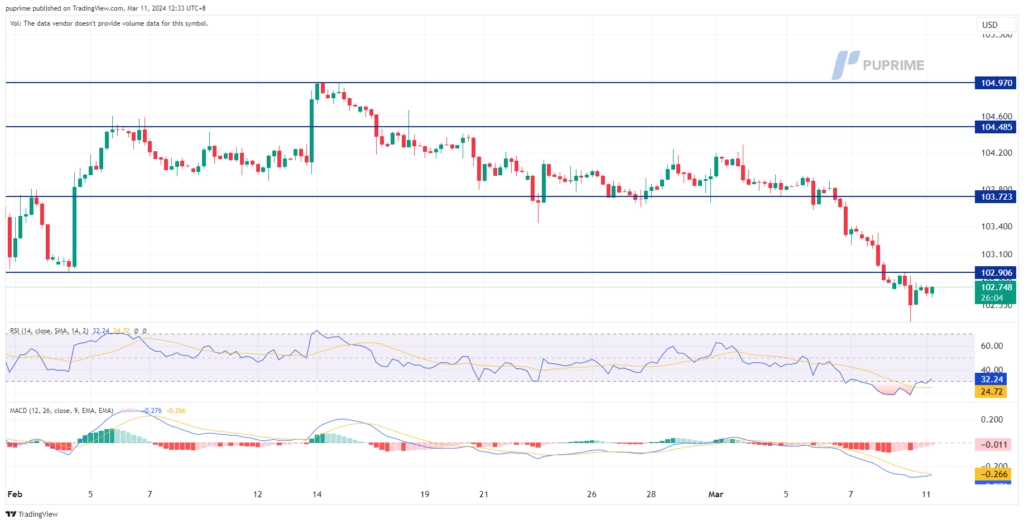
The US Dollar grapples with losses as key employment indicators present a mixed picture. The disappointing unemployment rate and hourly earnings figures contrast with a robust non-farm payroll report, leaving the greenback in a delicate position. Bloomberg reports reveal that Federal Reserve Chair Jerome Powell and colleagues are moving closer to revising their inflation strategy. Powell emphasises the need for “just a bit more evidence” before considering a shift in the central bank’s approach. His recent congressional testimony suggests a potential willingness to cut interest rates in the short term, pending further confirmation of inflation trends toward the 2% target.
The Dollar Index is trading lower following the prior breakout below the previous support level. However, MACD has illustrated diminishing bearish momentum, while RSI is at 28, suggesting the index might enter oversold territory.
Resistance level: 103.70, 104.50
Unterstützungsniveau:102,10, 101,35
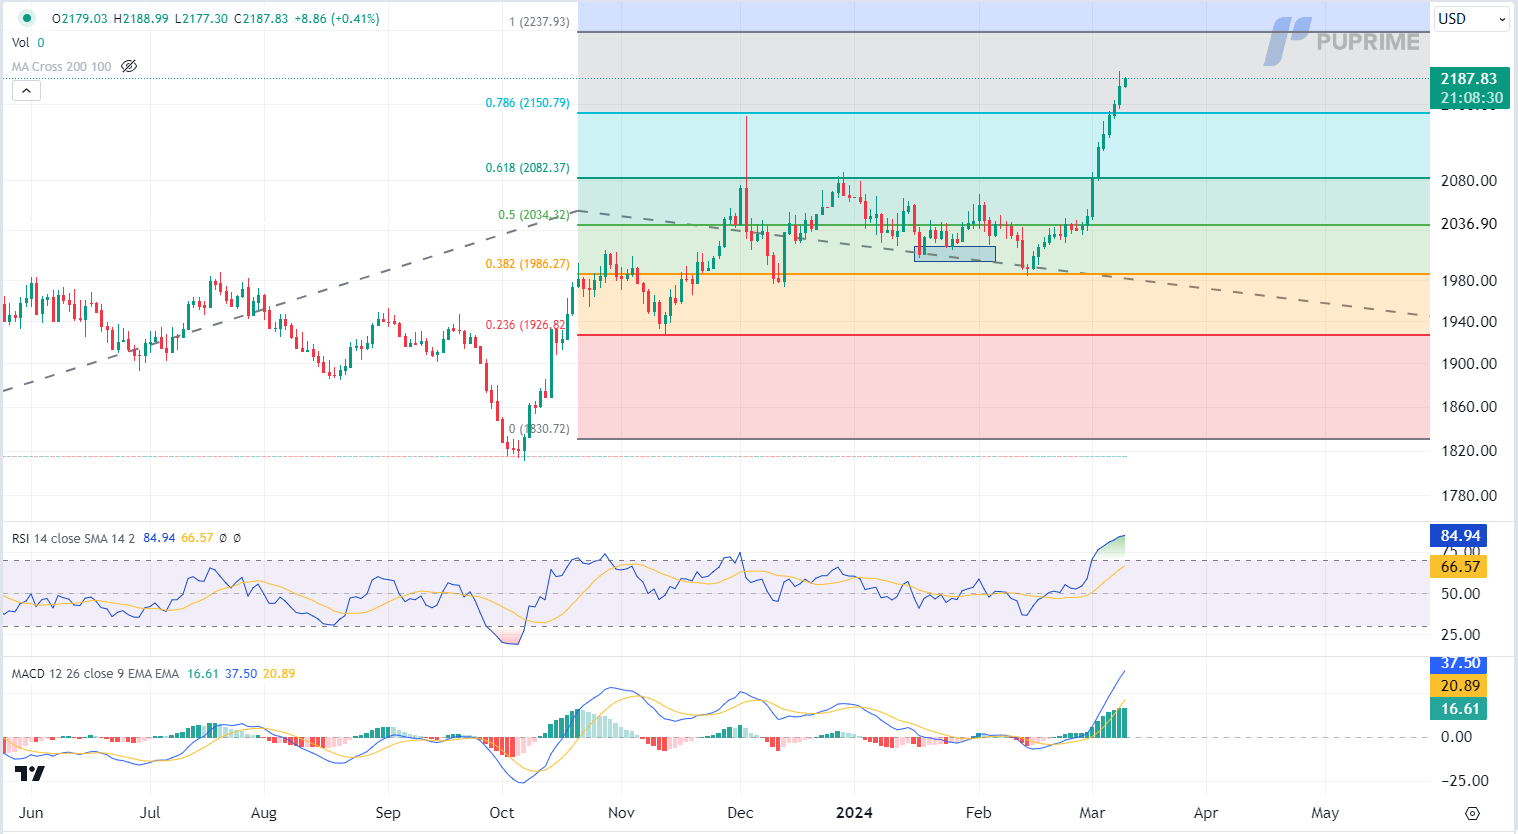
Gold prices enjoy continued gains, propelled by a weakening US Dollar. A series of lacklustre US economic data, coupled with dovish statements from the Federal Reserve, diminish the appeal of the greenback. The focus shifts to forthcoming inflation reports, where a continued decline in US inflation may heighten expectations for Fed interest rate cuts, further supporting gold market demand.
Gold prices are trading higher following the prior breakout above the previous resistance level. MACD has illustrated increasing bullish momentum. However, RSI is at 85, suggesting the commodity might enter overbought territory.
Widerstandsniveau: 2235,00, 2350,00
Unterstützungsniveau:2150,00, 2080,00
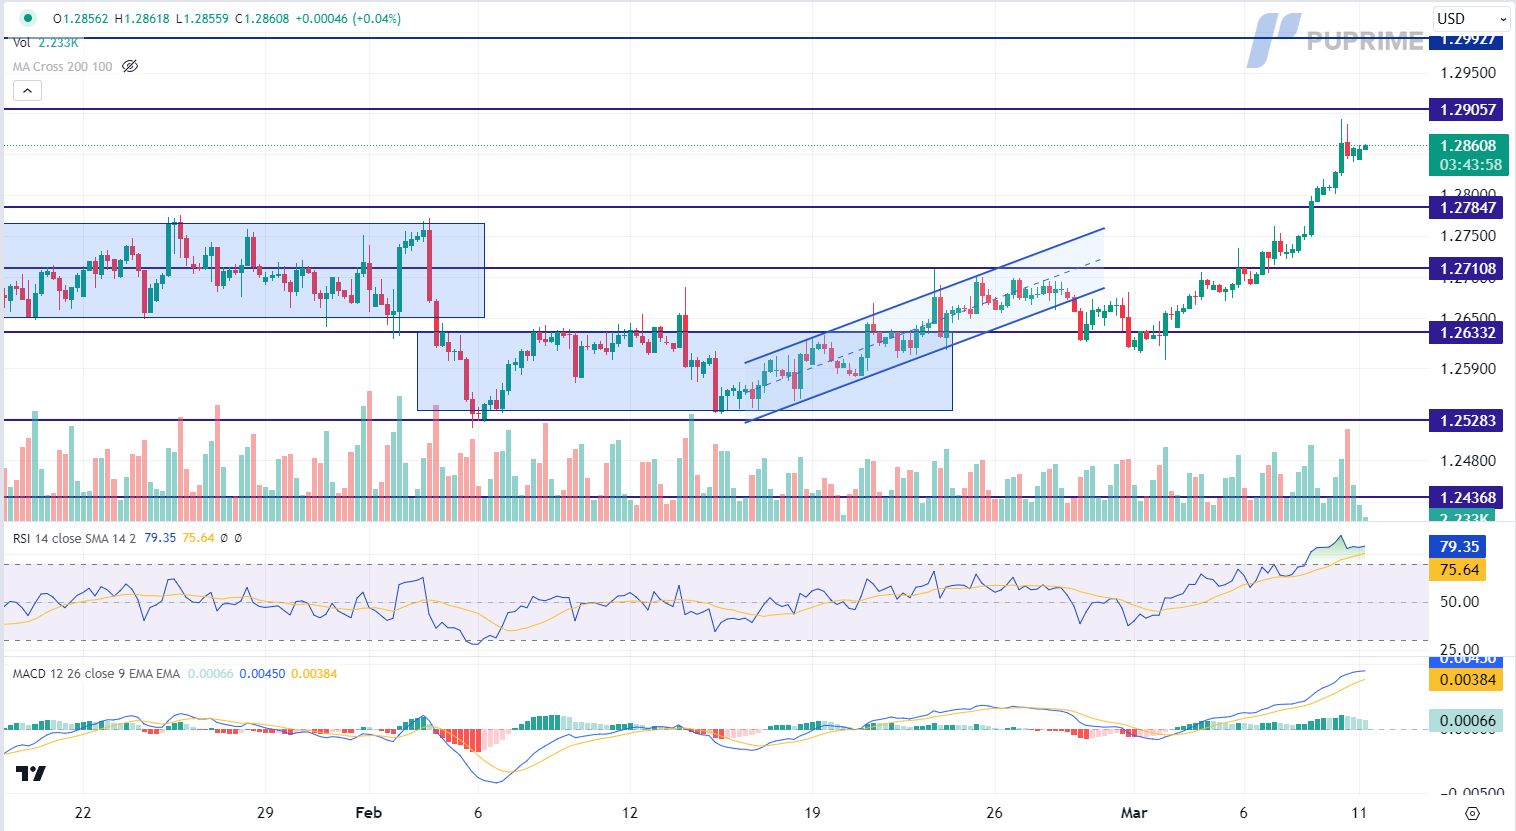
Pound Sterling experiences a surge against the US Dollar, propelled by discouraging US Unemployment data. The US Bureau of Labor Statistics (BLS) reports soft wage growth and a notable spike in the Unemployment rate for February. Despite better-than-expected Nonfarm Payroll data, the pessimistic economic outlook fuels expectations of a Federal Reserve interest rate cut before the Bank of England, introducing a potential policy divergence. Market participants anticipate a Fed rate cut in June, while expectations for a BoE rate cut loom from August.
GBP/USD is trading higher following the prior breakout above the previous resistance level. However, MACD has illustrated diminishing bullish momentum, while RSI is at 79, suggesting the pair might experience technical correction since the RSI retreated sharply from overbought territory.
Widerstandsniveau:1,2905, 1,2995
Unterstützungsniveau: 1,2785, 1,2710
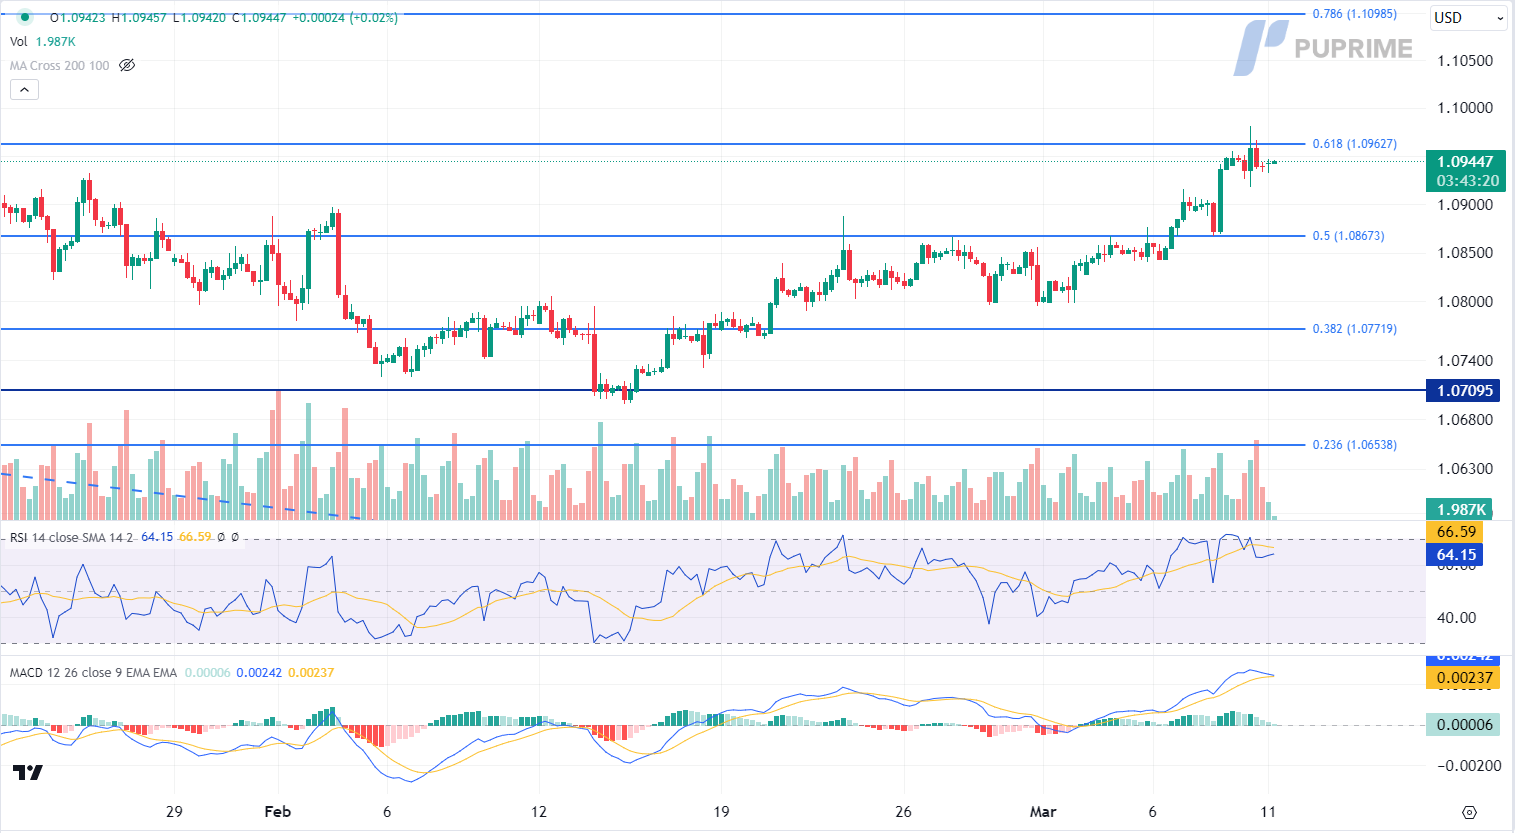
The EUR/USD pair continues its upward momentum, primarily driven by the depreciation of the US Dollar. Despite the worse-than-expected US Unemployment rate and Average Hourly Earnings, triggering a significant sell-off in the Greenback, the Euro remains resilient. While the Eurozone lacks significant market catalysts, the unexpected recovery in Germany’s Year-on-Year Producer Price Index (PPI) for January at -4.4%, surpassing expectations of -6.60%, further bolsters the Euro’s strength against the Dollar. The EU Gross Domestic Product (GDP) aligns with market expectations at 0.0% for Q4.
EUR/USD is trading higher while currently testing the resistance level. However, MACD has illustrated diminishing bullish momentum, while RSI is at 64, suggesting the pair might enter overbought territory.
Resistance level: 1.0965, 1.1100
Support level: 1.0865, 1.0770
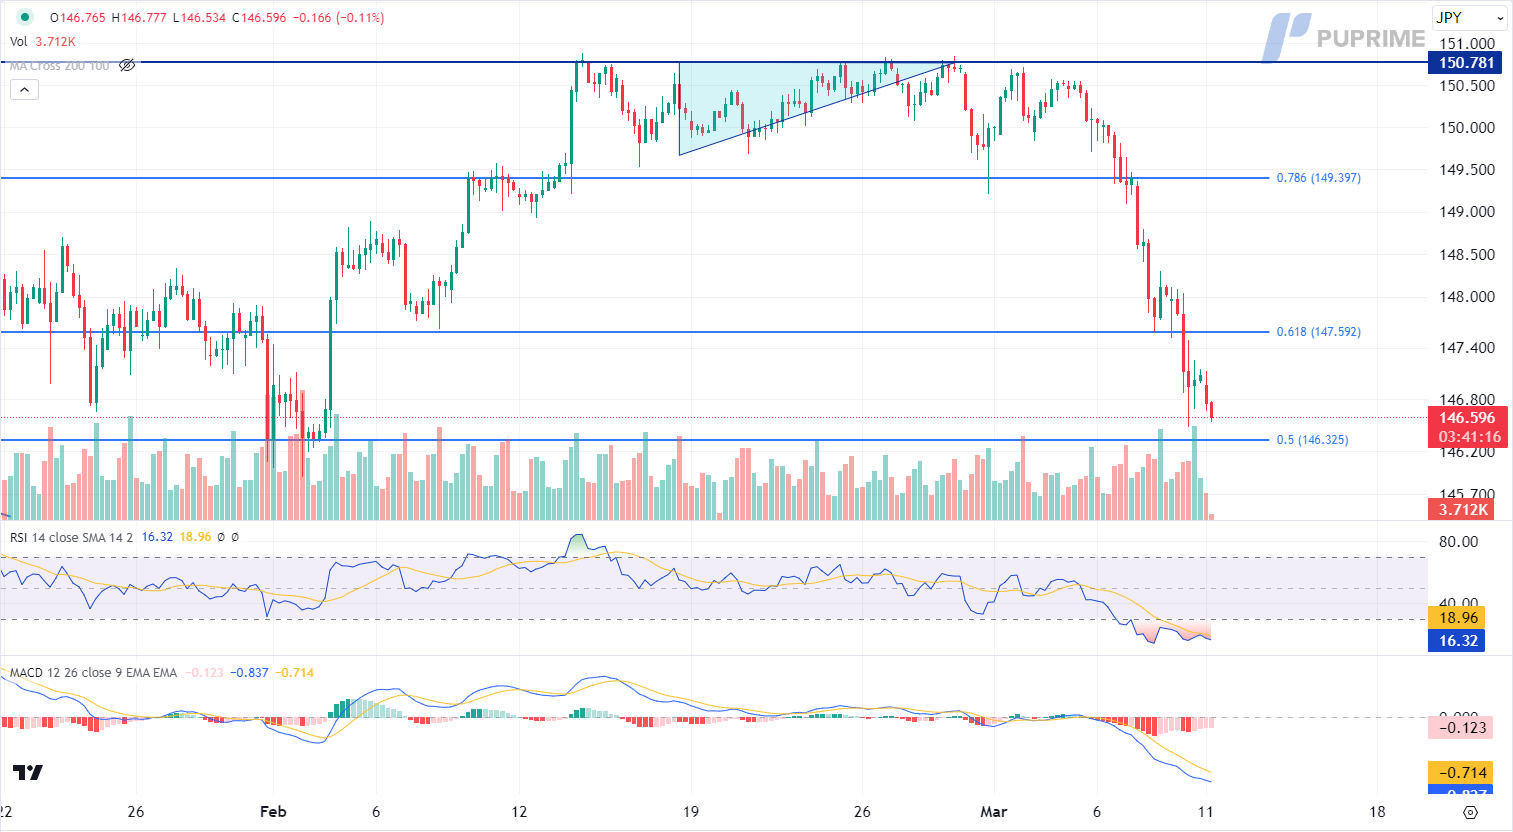
The USD/JPY pair extends its aggressive decline, weighed down by a narrowing interest rate differential between the US and Japan. Growing anticipation of the Bank of Japan exiting ultra-dovish policies fuels market demand for the Japanese yen. Policymakers’ emphasis on a positive wage cycle and the potential for inflation to surpass the 2% target further intensify expectations for a tightening monetary cycle.
USD/JPY is trading lower while currently testing the support level. However, MACD has illustrated diminishing bearish momentum, while RSI is at 16, suggesting the pair might enter oversold territory.
Resistance level: 147.60, 149.40
Support level: 146.35, 145.05
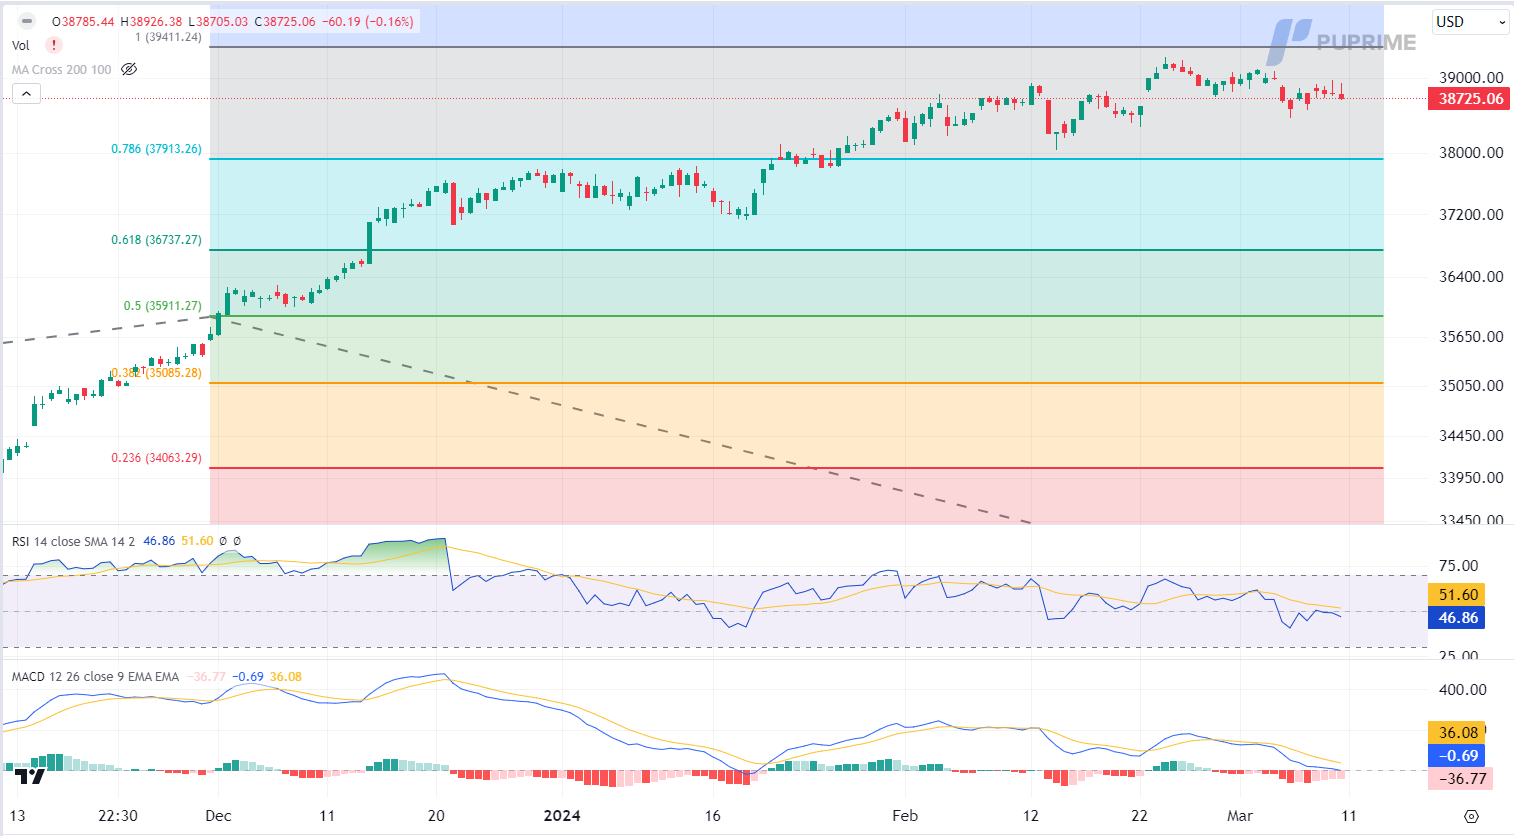
The US equity market faced continued downward pressure, notably in the technology sector, as profit-taking persisted. Heightened risk aversion dominates the market, with investor attention shifting towards imminent inflation data, particularly the crucial consumer price index (CPI) figures scheduled for later this week. The outcome could wield significant influence over Federal Reserve monetary policy expectations, potentially sparking volatility in both US Treasury yields and equity market movements.
Der Dow wird flach gehandelt und befindet sich derzeit in der Nähe der Widerstandsmarke. Der MACD zeigt jedoch ein abnehmendes bärisches Momentum, während der RSI bei 47 liegt, was darauf hindeutet, dass der Index eine technische Korrektur erfahren könnte, da der RSI aus dem überverkauften Bereich stark angestiegen ist.
Widerstandsniveau: 39400.00, 40000.00
Unterstützungsniveau: 37915,00, 36735,00
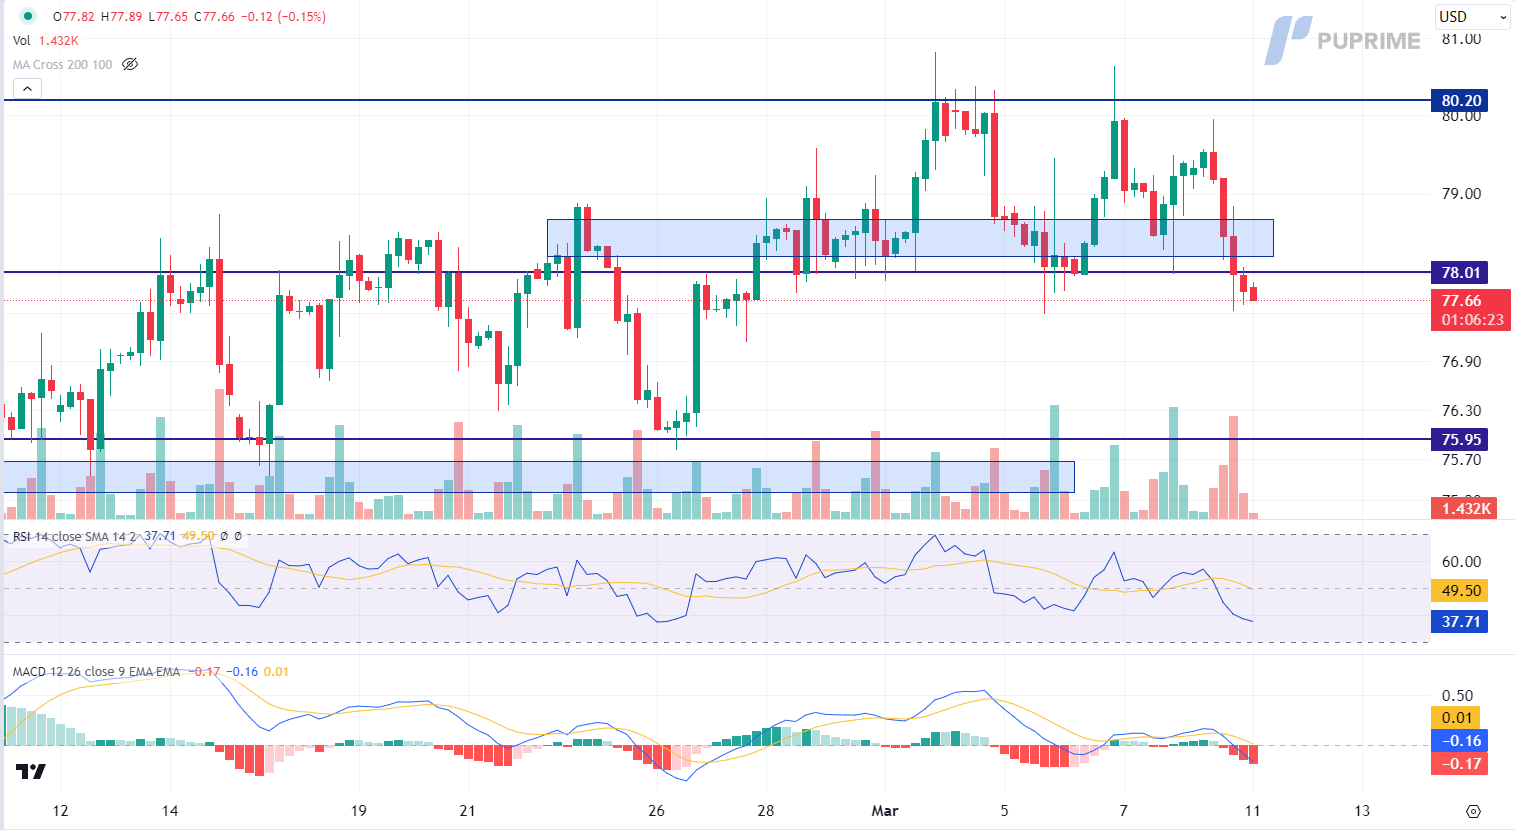
Crude oil prices experience a slight dip as apprehensions persist over soft Chinese demand. Despite OPEC+ extending supply cuts, China’s conservative economic growth target of around 5% for 2024 raises concerns. Analysts emphasise the challenging outlook without additional stimulus measures. Attention shifts to major central banks’ potential rate cuts, including the Federal Reserve and the ECB, as lower rates could stimulate oil demand by fostering economic growth.
Oil prices are trading lower following the prior breakout below the previous support level. MACD has illustrated increasing bearish momentum, while RSI is at 38, suggesting the commodity might extend its losses since the RSI stays below the midline.
Widerstandsniveau: 78,00, 80,20
Unterstützungsniveau: 75,95, 73,45

Handeln Sie Forex, Indizes, Metalle und mehr zu branchenweit niedrigen Spreads und mit blitzschneller Ausführung.
Registrieren Sie sich für ein PU Prime Live-Konto mit unserem unkomplizierten Verfahren
Zahlen Sie bequem über verschiedene Kanäle und in verschiedenen Währungen auf Ihr Konto ein
Erhalten Sie Zugang zu Hunderten von Instrumenten zu marktführenden Handelsbedingungen
Handelsplattformen
Lernen
Über PU Prime
Unternehmen

Bitte beachten Sie, dass die Website für Personen bestimmt ist, die in Ländern ansässig sind, in denen der Zugriff auf die Website gesetzlich zulässig ist.
Bitte beachten Sie, dass PU Prime und die mit ihr verbundenen Unternehmen nicht in Ihrem Heimatland ansässig oder tätig sind.
Indem Sie auf die Schaltfläche "Bestätigen" klicken, bestätigen Sie, dass Sie diese Website ausschließlich aus eigener Initiative und nicht als Ergebnis einer speziellen Marketingaktion besuchen. Sie möchten Informationen von dieser Website erhalten, die auf umgekehrte Weise in Übereinstimmung mit den Gesetzen Ihres Heimatlandes zur Verfügung gestellt werden.
Vielen Dank für Ihre Rückmeldung!
Beachten Sie, dass die Website für Personen bestimmt ist, die in Rechtsgebieten wohnen, in denen der Zugang zur Website nach dem Gesetz erlaubt ist.
Beachten Sie, dass PU Prime und seine Tochtergesellschaften nicht in Ihrem Heimatland ansässig sind und nicht in Ihrem Land arbeiten.
Al hacer clic en el botón "Aceptar", confirmas que estás ingresando a este sitio web por tu propia iniciativa y no como resultado de ningún esfuerzo de marketing específico. Deseas obtener información de este sitio web que se proporciona mediante solicitud inversa de acuerdo con las leyes de tu jurisdicción de origen.
Vielen Dank für Ihre Rückmeldung!