


App herunterladen
-
- Handelsplattformen
- PU Prime App
- MetaTrader 5
- MetaTrader 4
- PU Copy Trading
- Web Trader
- PU Social


DE
App herunterladen
28 November 2023,09:07
Daily Market Analysis
28 November 2023, 09:07

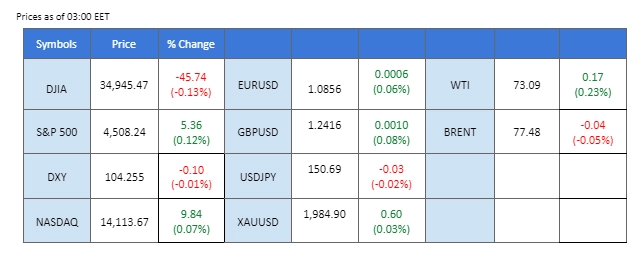
The financial markets experienced a relatively subdued session overnight, lacking significant catalysts to drive decisive movements. Investor attention remains focused on the APEC forum, with particular interest in the meeting between President Biden and President Xi, especially given the backdrop of the prolonged trade war. In the energy markets, oil prices registered a notable 5% decline yesterday as concerns over crude oil demand persisted, despite the onset of the winter season. Eyes are now on the upcoming OPEC meeting in December, where market participants will closely monitor the cartel’s efforts to stabilise oil prices. Additionally, anticipation surrounds the release of UK’s Retail Sales data later today, which could serve as a potential catalyst influencing the strength of the Sterling.
Current rate hike bets on 13rd December Fed interest rate decision:
Source: CME Fedwatch Tool
0 bps (95.0%) VS 25 bps (5%)
The US Dollar undergoes extended losses as US Initial Jobless Claims missing expectations, signalling a potential cooling in the labour market. The rise from 218K to 231K, missing the anticipated 220K, prompts market concerns, leading to speculation about the Federal Reserve’s timeline for concluding its monetary tightening cycle in early 2024. A series of lacklustre economic indicators from the US further dampen optimism, eroding the attractiveness of the US Dollar.
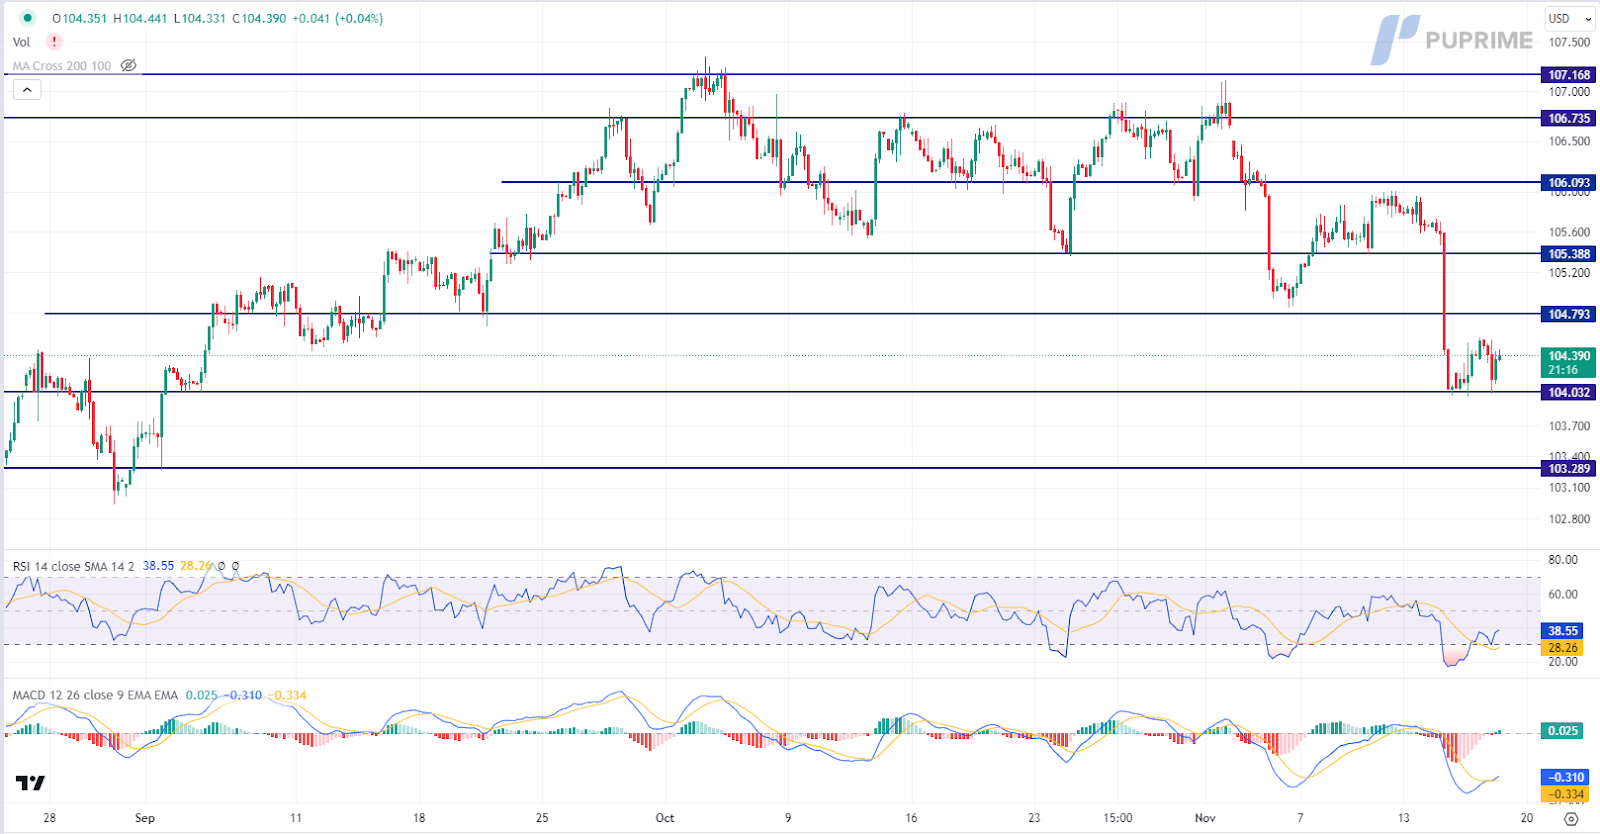
The Dollar Index is trading flat while currently near the support level. However, MACD has illustrated increasing bullish momentum, while RSI is at 39, suggesting the index might experience technical correction since the RSI rebounded sharply from oversold territory.
Resistance level: 104.80, 105.40
Support level: 104.05, 103.30
Gold prices stage a rebound in response to a slew of downbeat economic data emanating from the United States. The tumble of the US Dollar enhances demand for dollar-denominated gold. Ongoing uncertainties surrounding US-China relations add an additional layer of complexity to the market, prompting investors to closely monitor developments in the bilateral meetings for nuanced trading signals.
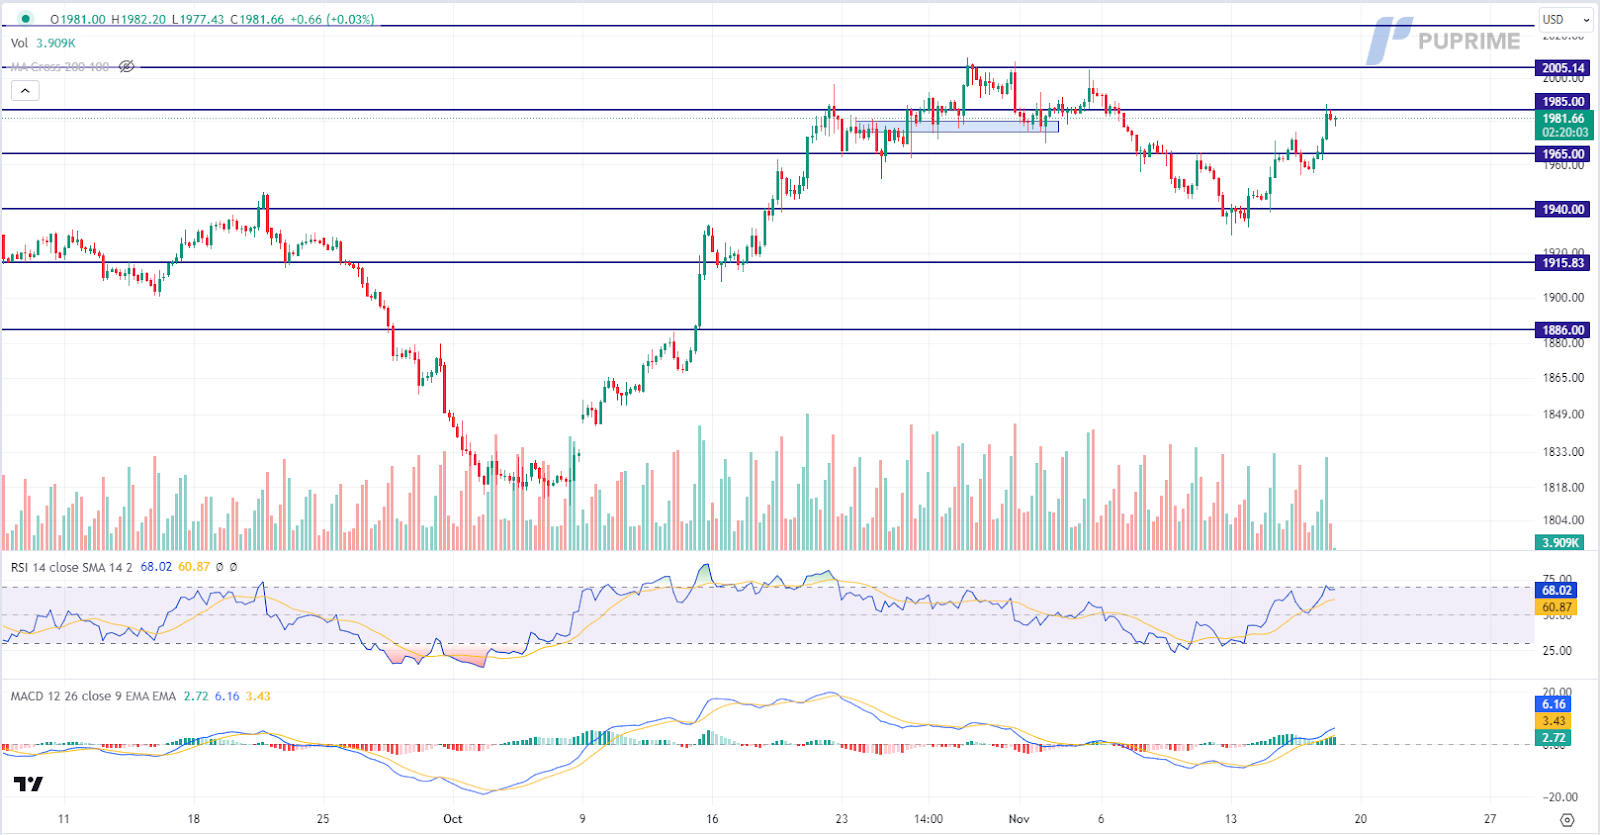
Gold prices are trading higher while currently testing the resistance level. MACD has illustrated increasing bullish momentum. However, RSI is at 68, suggesting the commodity might enter overbought territory.
Resistance level: 1985.00, 2005.00
Support level: 1965.00, 1940.00
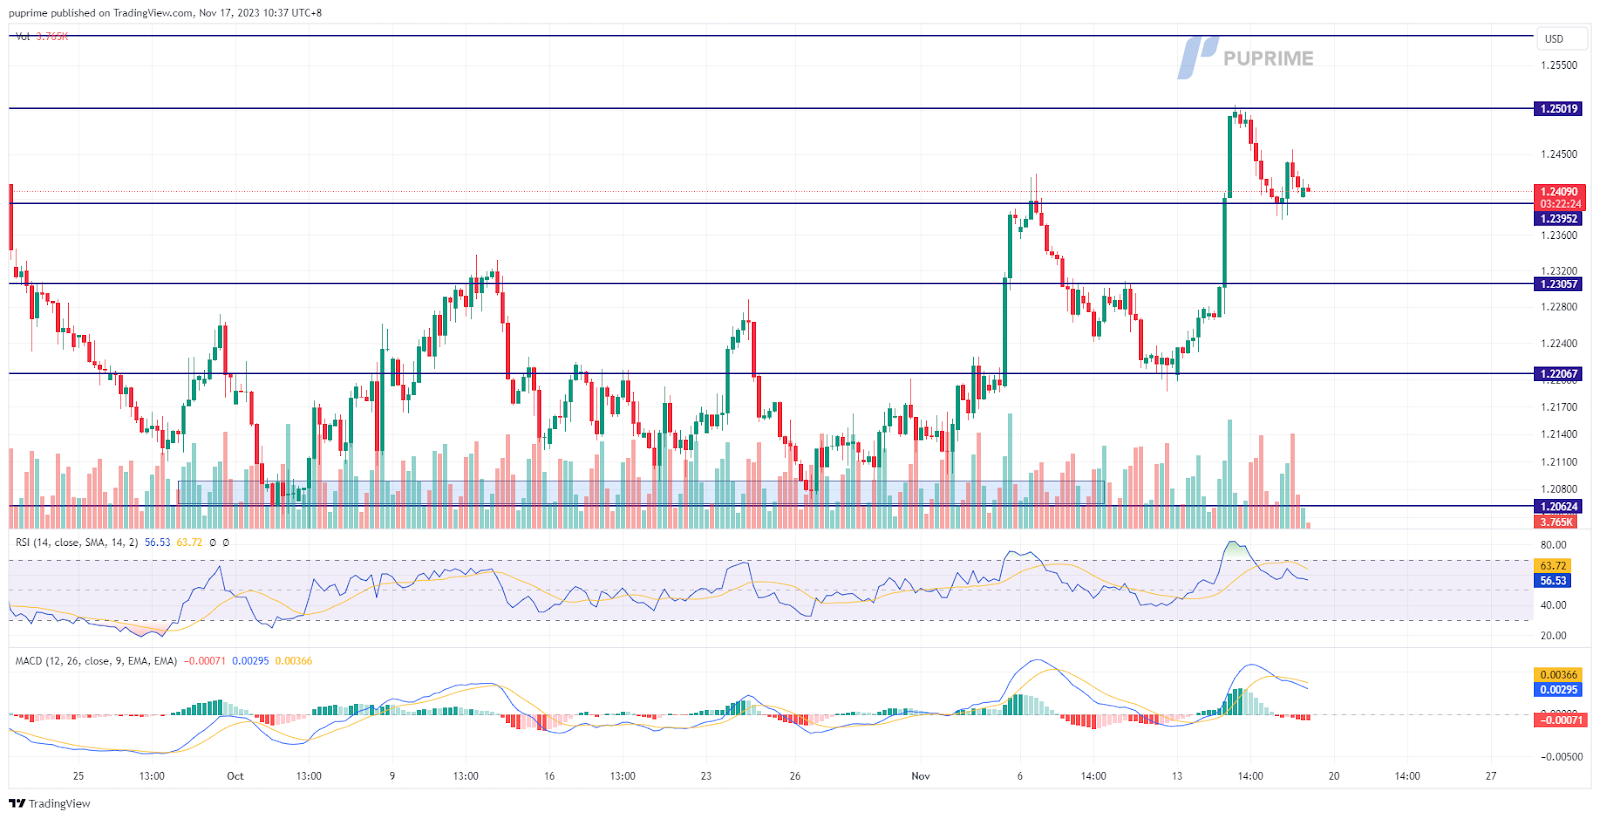
The U.S. dollar persists in its decline, fueled by economic data falling below expectations and exerting pressure on its strength. Notably, U.S. initial jobless claims indicate ongoing softness in the job market, contributing to lower inflation and reinforcing the perception that U.S. interest rates may have peaked. Attention now shifts to the upcoming release of UK’s Retail Sales data, which could catalyse movements in the Cable.
The Cable has further eased from its highest level since September, and the momentum indicators show the bullish momentum is diminishing. The RSI has dropped out of the overbought zone while the MACD has crossed and is moving downward.
Resistance level: 1.2501, 1.2590
Support level: 1.2306, 1.2207
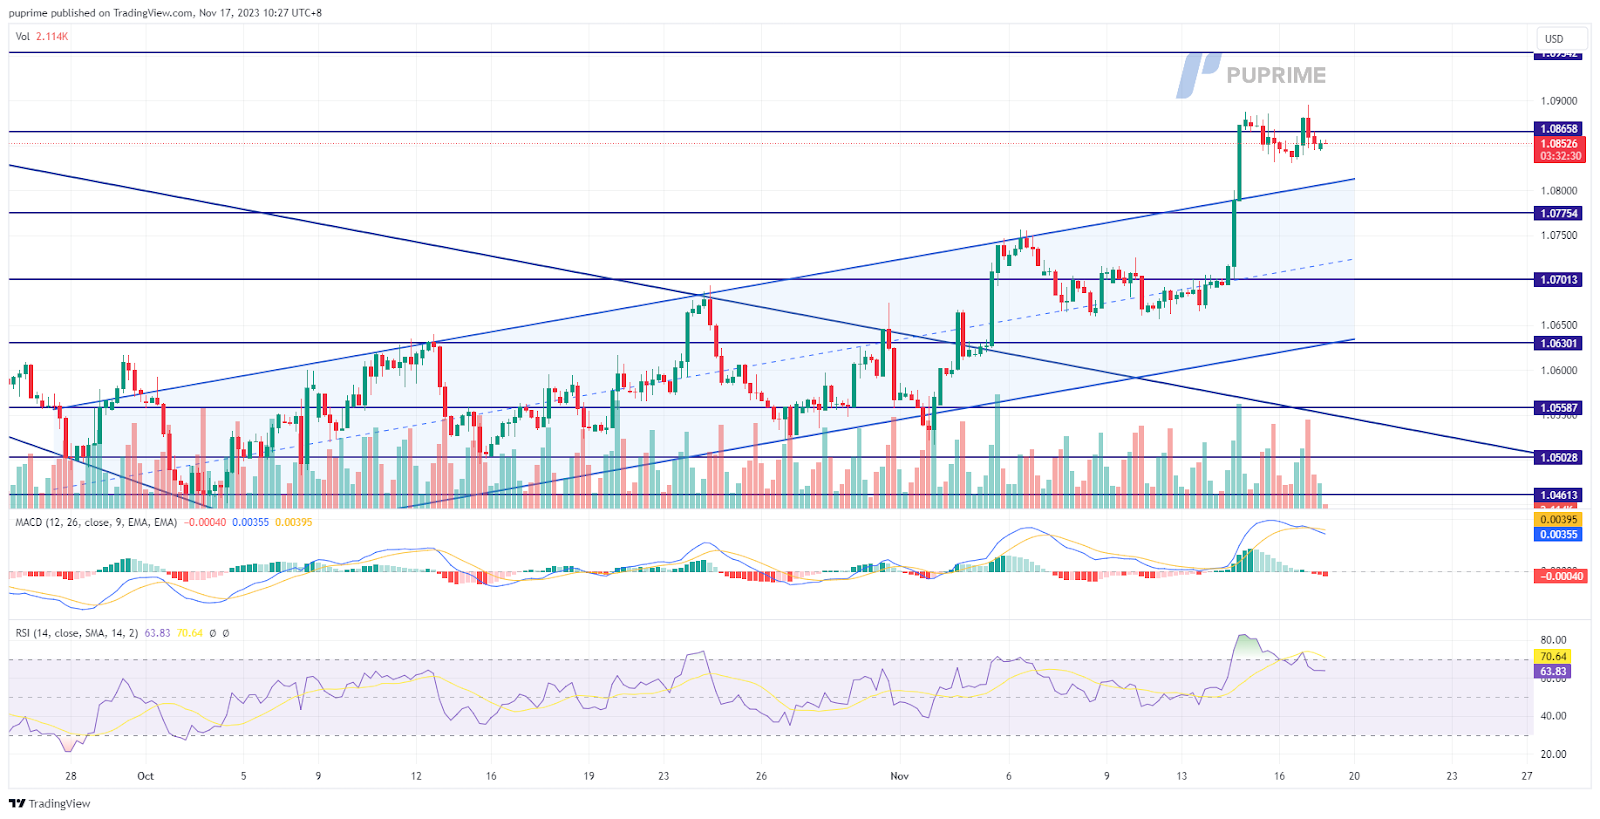
The EUR/USD maintains an elevated position, supported by a weakening U.S. dollar. The subdued dollar performance offers support not only to the euro but also to other currencies. The euro, however, encounters challenges amid the ongoing decline in U.S. treasury yields. In today’s session, the focus turns to the Eurozone’s CPI data, with expectations indicating a potential decrease compared to the previous reading, reflecting signs of inflation easing in euro member states.
The EUR/USD pair remained elevated after it broke above its uptrend channel. However, the momentum indicators suggest an easing in bullish momentum as the RSI has dropped out of the overbought zone while the MACD has crossed on the above.
Resistance level:1.0950, 1.1040
Support level: 1.0780, 1.0700
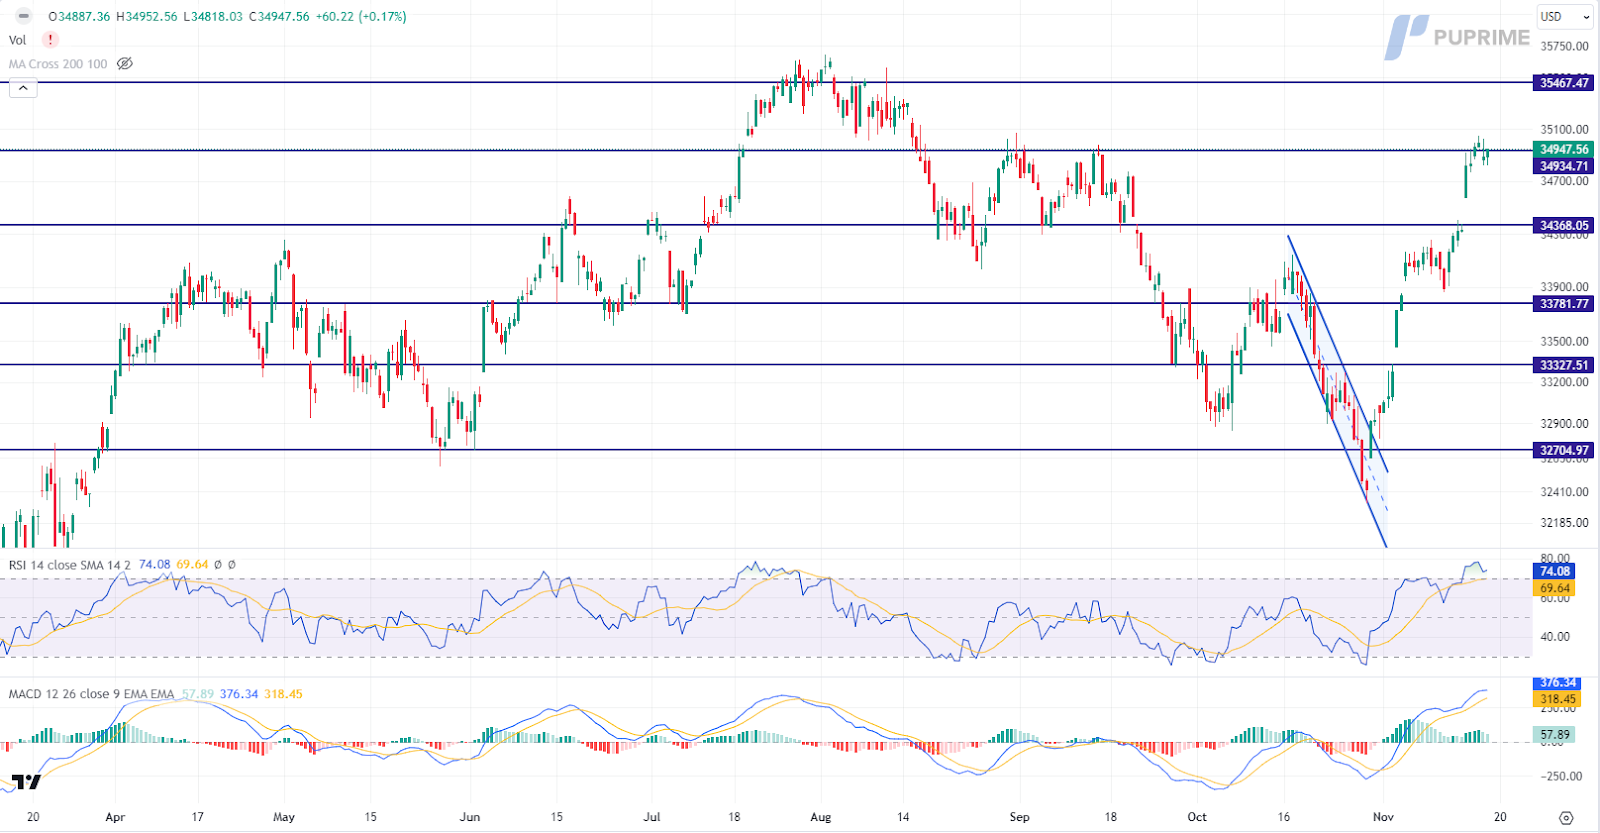
US equity markets adopt a flat trajectory amid mixed sentiment. On one hand, downbeat economic data prompts a drop in US Treasury yields, easing expectations of a tightening monetary cycle by the Federal Reserve. Disappointing financial results from tech giant Cisco and retail behemoth Walmart weigh on the main equity index. Cisco’s 9.8% tumble follows a cut in full-year revenue and profit forecasts, while Walmart’s 8.1% decline is attributed to cautious consumer spending amidst inflation, despite an upward revision in annual sales and profit forecasts.
The Dow is trading flat while currently testing the resistance level. However, MACD has illustrated diminishing bullish momentum, while RSI is at 74, suggesting the index might enter overbought territory.
Resistance level:34935.00, 35465.00
Support level: 34935.00, 33780.00
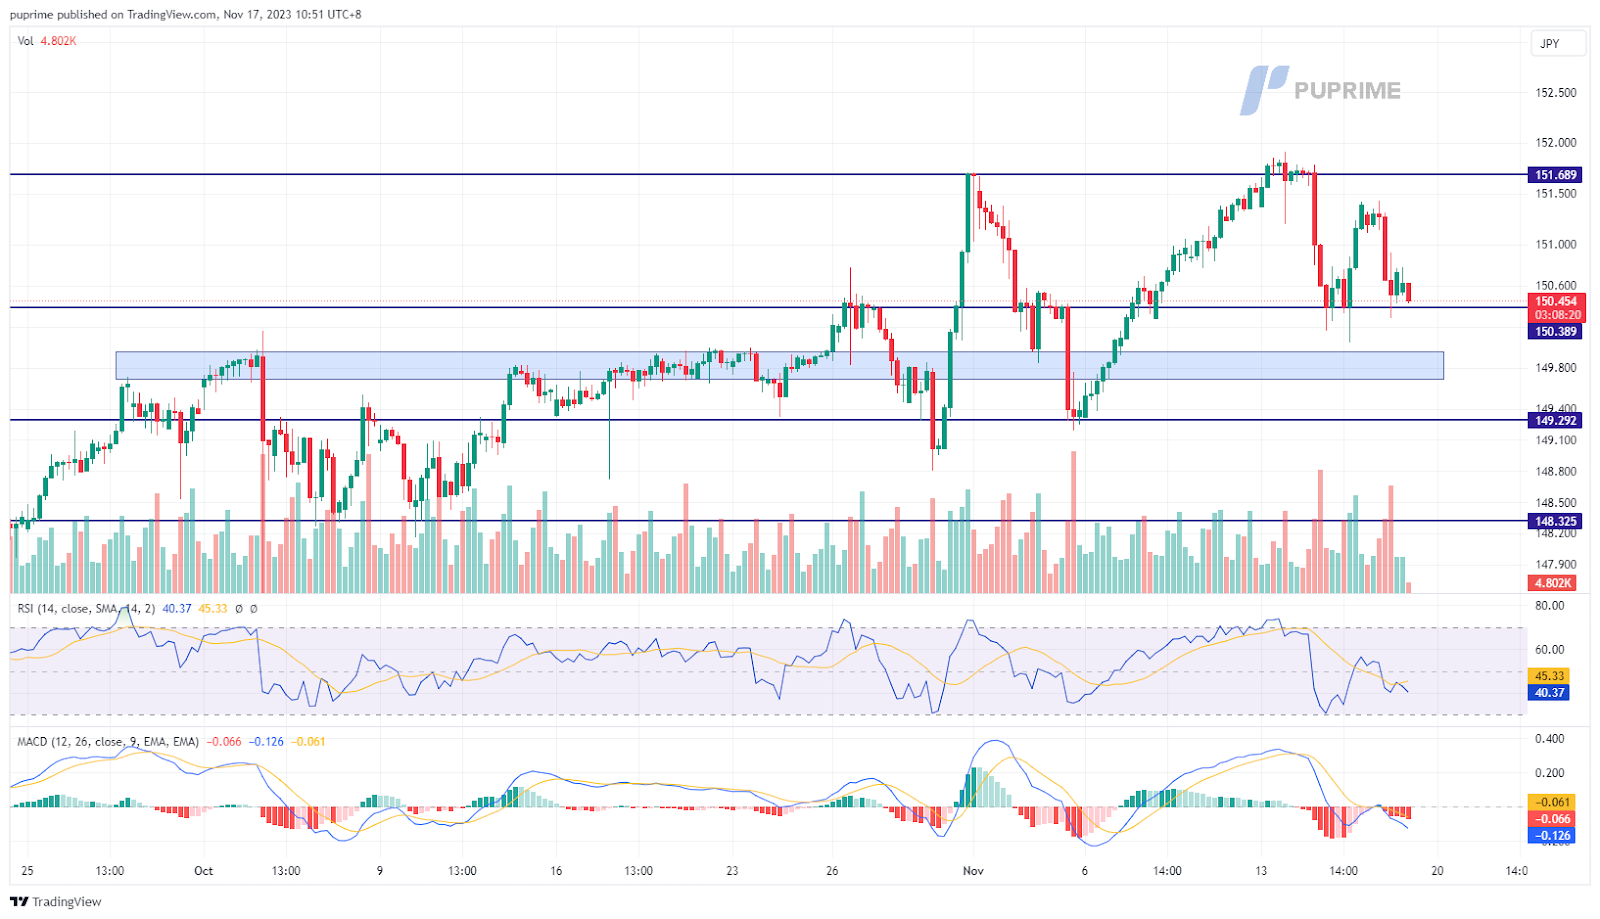
The USD/JPY witnessed a decline of almost 0.5% yesterday and extended its slide into the Asian session. The higher-than-expected U.S. Initial Jobless Claims figure, indicating a softer job market, contributed to the weakening of the U.S. dollar. Conversely, the Bank of Japan (BoJ) adopted a more hawkish stance in recent speeches, suggesting a potential end to their ultra-loose monetary policy. This shift in tone strengthened the Japanese Yen.
USD/JPY is trading in a lower-high price pattern, suggesting a bearish trend. The RSI has been hovering in the lower region while the MACD has stayed under the zero line, suggesting the bearish momentum is forming.
Resistance level: 151.70, 152.70
Support level: 150.40, 149.30
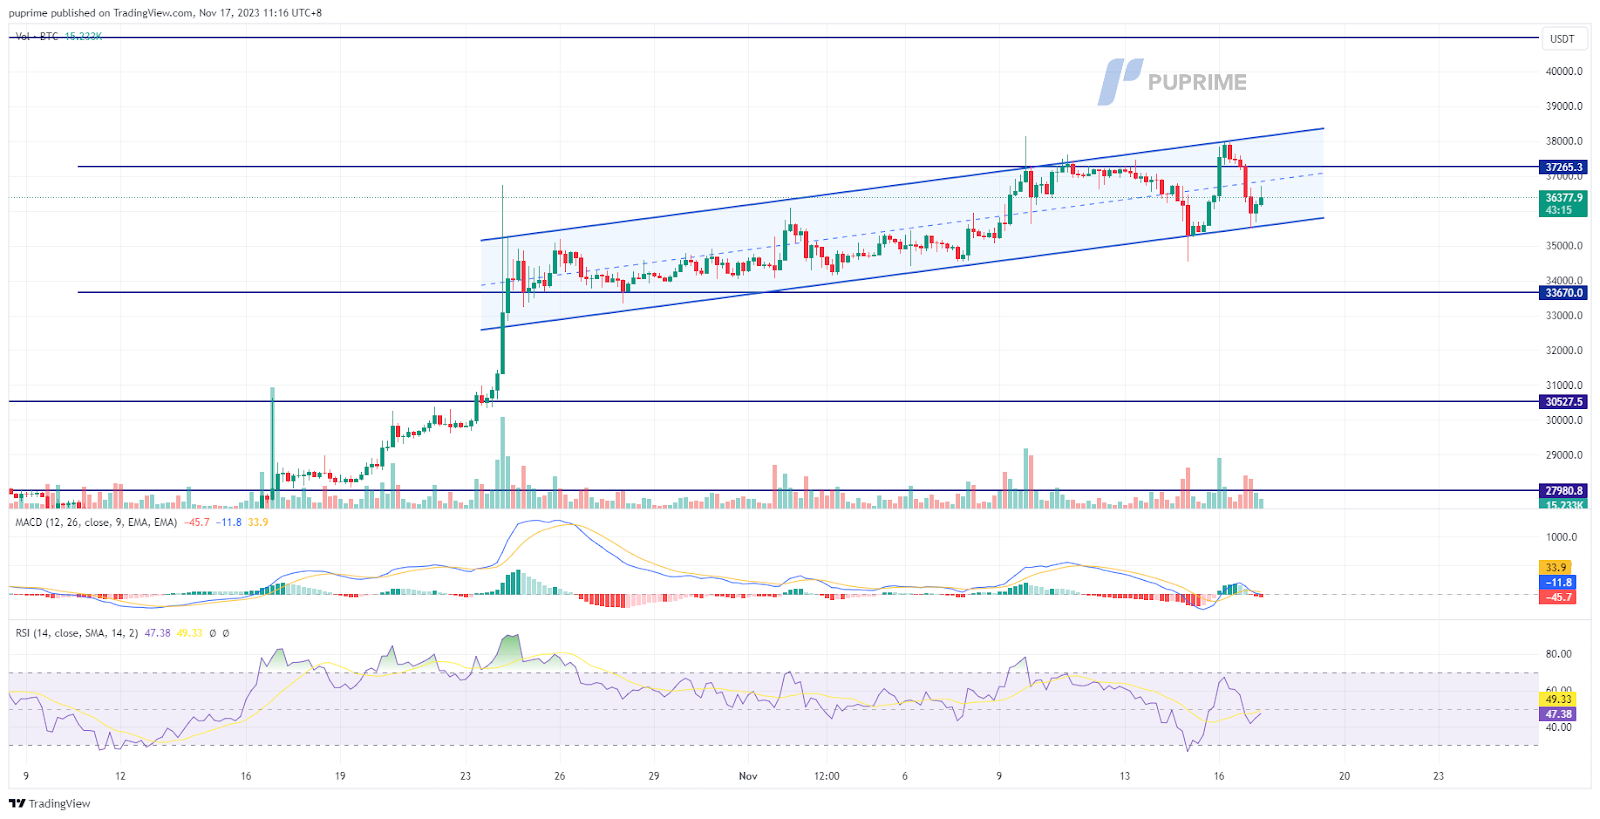
Bitcoin experienced a decline of over 4.5% yesterday but remains within its established uptrend channel. The global economic outlook has been sombre, marked by disappointing data from various countries, impacting the risk-on sentiment in the market. Additionally, the U.S. Securities and Exchange Commission (SEC) has postponed its decision on the Spot Bitcoin Exchange-Traded Fund (ETF) to January next year, leaving the market without a significant catalyst until then.
BTC remains in an uptrend channel, suggesting a bullish trend for BTC. However, the bullish momentum seems eased as the RSI dropped the near 50-level and MACD has been hovering near the zero line.
Resistance level: 37260, 40960
Support level: 33670, 30520
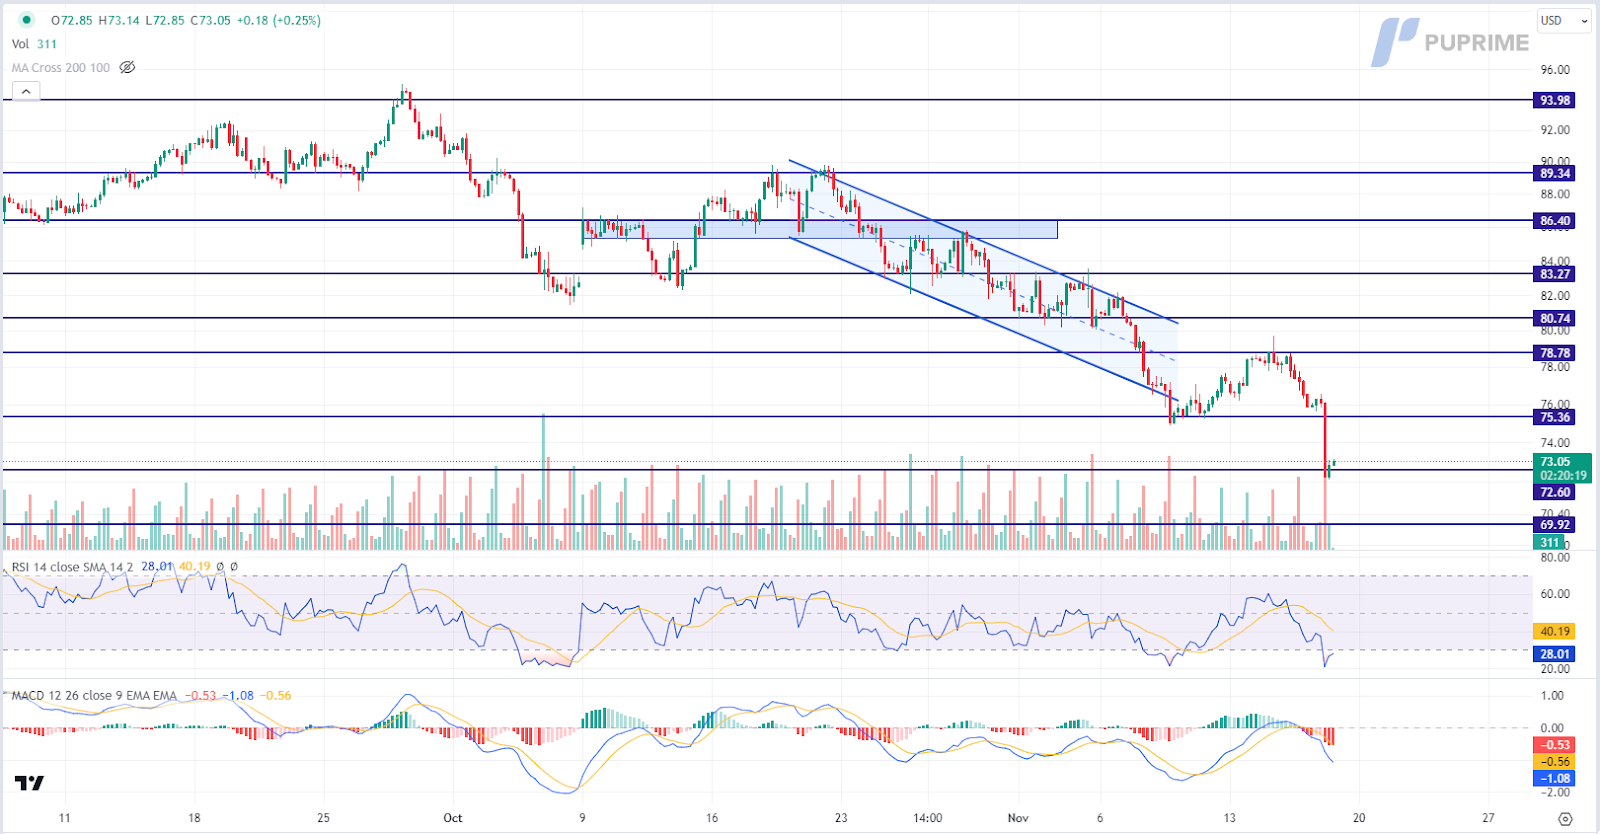
Oil prices face a fourth consecutive weekly decline, influenced by increasing US crude stockpiles and signs of a slowing economic progression in China, the world’s largest oil importer. Worries intensify as Chinese refiners process lower oil amounts in October compared to the previous month. US Energy Information Administration (EIA) data further underscores concerns about oil demand, revealing a substantial rise in US crude stocks beyond expectations.
Oil prices are trading lower while currently testing the support level. MACD has illustrated increasing bearish momentum. However, RSI is at 28, suggesting the commodity might enter oversold territory.
Resistance level: 75.35, 78.80
Support level: 72.60, 69.90

Traden Sie Forex, Indizes, Metalle und mehr zu branchenweit niedrigen Spreads und mit blitzschneller Ausführung.
Registrieren Sie sich für ein PU Prime Live-Konto mit unserem unkomplizierten Verfahren
Zahlen Sie bequem über verschiedene Kanäle und in verschiedenen Währungen auf Ihr Konto ein
Erhalten Sie Zugang zu Hunderten von Instrumenten zu marktführenden Tradingbedingungen
Handelsplattformen
Lernen
Über PU Prime
Unternehmens

Please note the Website is intended for individuals residing in jurisdictions where accessing the Website is permitted by law.
Please note that PU Prime and its affiliated entities are neither established nor operating in your home jurisdiction.
By clicking the "Acknowledge" button, you confirm that you are entering this website solely based on your initiative and not as a result of any specific marketing outreach. You wish to obtain information from this website which is provided on reverse solicitation in accordance with the laws of your home jurisdiction.
Thank You for Your Acknowledgement!
Ten en cuenta que el sitio web está destinado a personas que residen en jurisdicciones donde el acceso al sitio web está permitido por la ley.
Ten en cuenta que PU Prime y sus entidades afiliadas no están establecidas ni operan en tu jurisdicción de origen.
Al hacer clic en el botón "Aceptar", confirmas que estás ingresando a este sitio web por tu propia iniciativa y no como resultado de ningún esfuerzo de marketing específico. Deseas obtener información de este sitio web que se proporciona mediante solicitud inversa de acuerdo con las leyes de tu jurisdicción de origen.
Thank You for Your Acknowledgement!