Tag Archive: How-to
Doji-Candlestick-Analyse: Wie man Marktumkehrungen erkennt
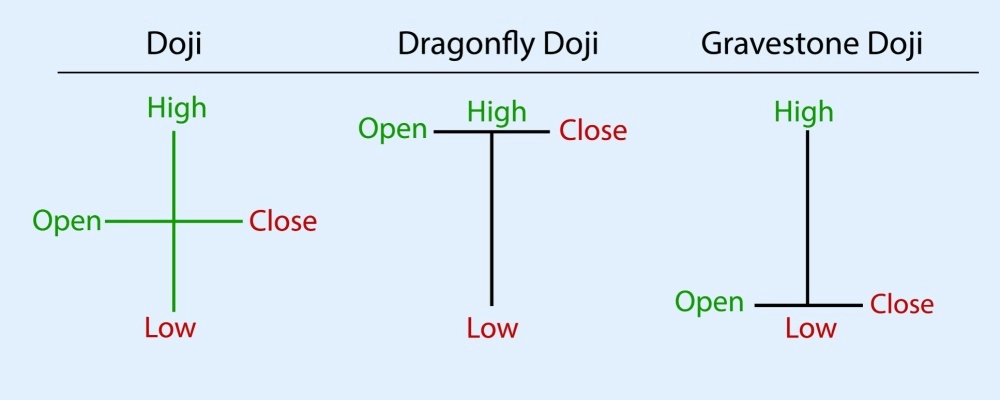
The Doji candlestick pattern is one of the most important patterns to master in financial market analysis. This very peculiar pattern represents the never-ending war between the buyers and sellers of the financial world. Because of their peculiarness, they are a critical indicator of a potential reversal in the market. Unlike many other patterns, theLesen Sie weiter
Wie man das Triple Bottom Pattern erkennt und handelt

In financial markets, price movements often follow identifiable patterns that traders can use to gauge potential future trends. Among these patterns, the triple bottom stands out as a formation that may indicate a transition from downward pressure to a more bullish outlook. At its core, the triple bottom pattern signals that sellers have tested aLesen Sie weiter
Umkehrkerzen verstehen: Wie man Marktwendepunkte erkennt

In financial markets, prices rarely move in a straight line. Instead, they ebb and flow in response to a complex interplay of economic events, investor sentiment, and global news. Amid this constant movement, traders often look for tell-tale signs that a current trend may be losing momentum and preparing to change direction. One such toolLesen Sie weiter