


App herunterladen
-
- Handelsplattformen
- PU Prime App
- MetaTrader 5
- MetaTrader 4
- PU Copy Trading
- Web Trader
- PU Social


DE
App herunterladen
Published: 15 September 2025,03:57
Intermediate

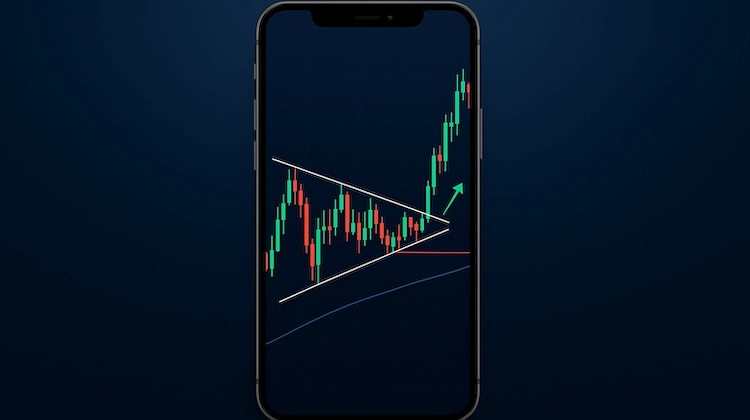
The symmetrical triangle pattern is a neutral chart formation that signals a period of market consolidation, often leading to a breakout. It forms between two converging trendlines (one connecting lower highs, the other connecting higher lows) as buying and selling pressure reach temporary equilibrium.
Traders use this pattern to anticipate potential breakout opportunities. While direction is not guaranteed, breakouts often align with the prior trend and are typically confirmed by increased volume. Risk management strategies include waiting for candle closes outside the pattern, setting logical stop-loss levels, and projecting price targets based on the pattern’s height.
Symmetrical triangles can appear across a wide range of markets, including forex, indices, commodities, and metals. With proper confirmation and discipline, this pattern can support a broader technical analysis strategy.
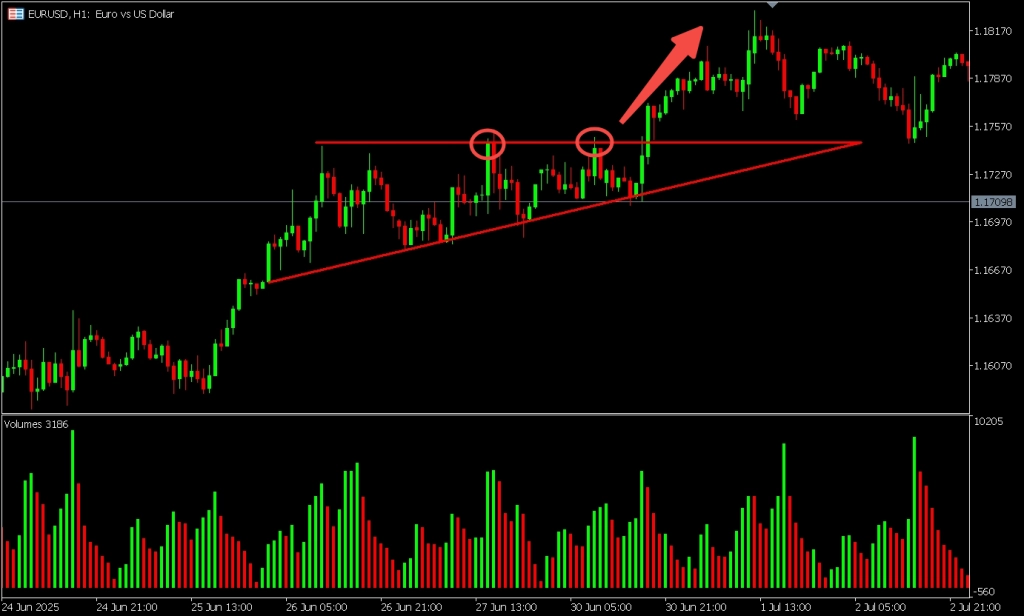
In technical analysis, the symmetrical triangle pattern is a popular chart formation that signals a period of market consolidation. It forms when two trendlines converge: one descending, connecting a series of lower highs, and one ascending, connecting a series of higher lows. As the price moves between these boundaries, it creates a triangle shape that gradually narrows toward a point known as the apex.
This pattern reflects a temporary balance between buying and selling pressure. Neither side is in control, which leads to smaller price swings over time. As the triangle progresses, the trading range tightens and volatility decreases. This compression often precedes a breakout, where price moves sharply above or below the triangle as momentum returns to the market.
The symmetrical triangle is commonly viewed as a neutral pattern. It does not inherently indicate direction until a confirmed breakout occurs. Traders typically monitor this setup closely, as it can signal the continuation of the previous trend or, in some cases, a potential reversal depending on the broader market context.
The symmetrical triangle pattern signals a period of consolidation where market forces are evenly matched. As prices narrow within converging trendlines, neither buyers nor sellers have enough strength to trigger a decisive trend. This stand-off reflects uncertainty, as market participants wait for more information before committing.
Each lower high indicates buyers are becoming more cautious, unable to push prices above previous peaks. At the same time, higher lows show sellers are struggling to push prices down. This pattern of compressed momentum suggests that both sides are repositioning before a larger move.
As the pattern develops, price action becomes tighter and trading volume typically decreases. Traders hesitate to enter new positions while waiting for a breakout. This shrinking activity represents stored energy, which often results in a sharp move once price escapes the pattern.
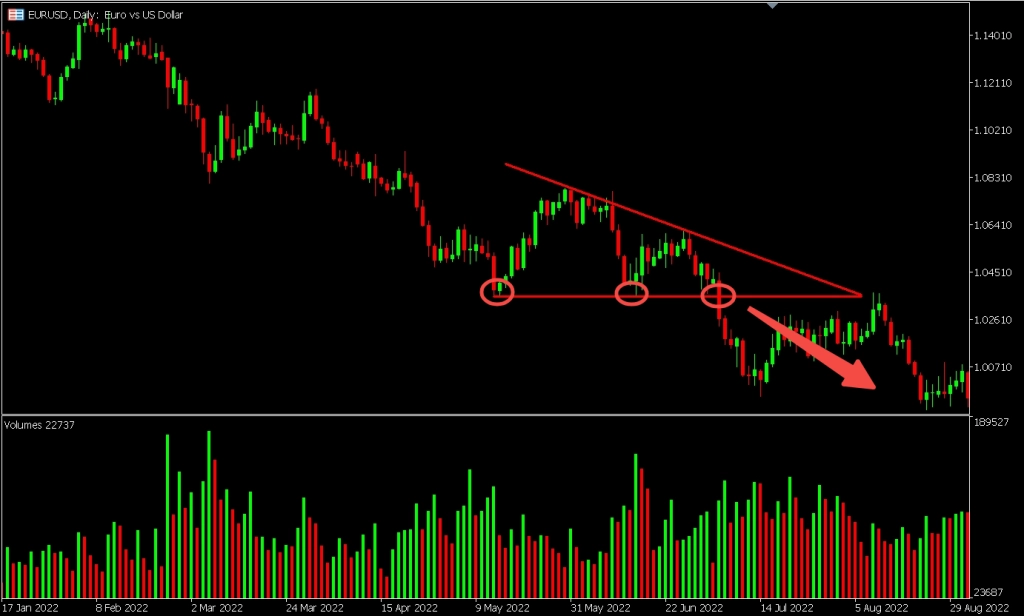
When the breakout happens, it typically signals that one side has gained control. If the breakout is to the upside, it suggests that bullish sentiment has returned. If the move is downward, bearish momentum may be taking over. In both cases, volume tends to rise sharply as participation increases. *chartschool.stockcharts.com
Key Takeaways
The symmetrical triangle reflects a temporary equilibrium between buyers and sellers. Lower highs and higher lows show reduced momentum on both sides. Volume often contracts within the pattern, then expands on breakout. A confirmed breakout suggests a shift in sentiment and market direction.
Symmetrical triangles typically form during periods of trend continuation. The most reliable patterns occur after a clear uptrend or downtrend. This existing trend sets the context for the consolidation that follows, helping traders interpret the potential breakout direction more effectively.
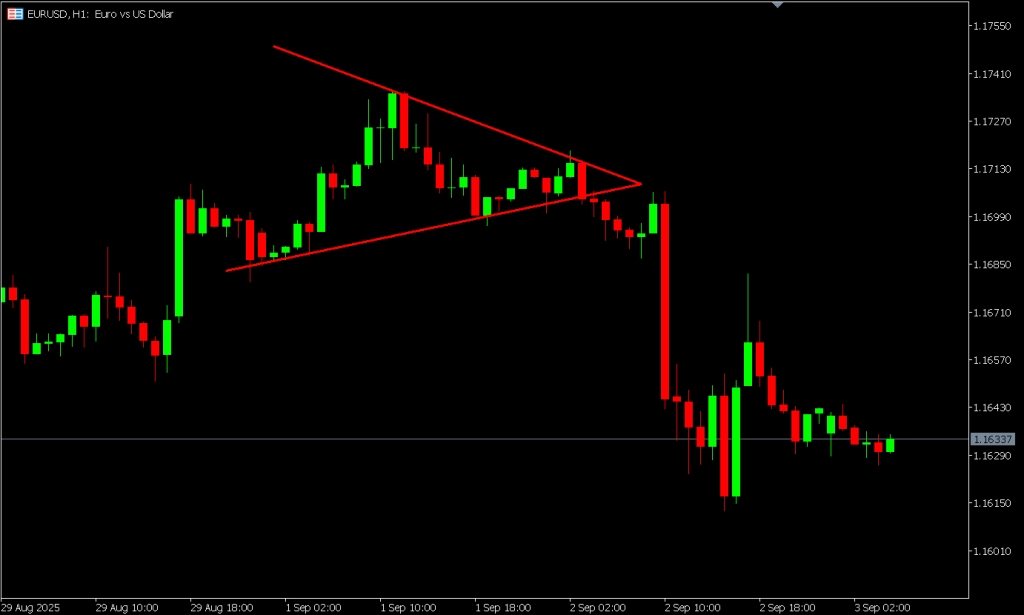
To identify the pattern, draw two trendlines that gradually move toward each other:
As the price compresses within this narrowing range, it forms a symmetrical triangle, with the trendlines pointing to a shared center point called the apex.
For a symmetrical triangle to be considered valid, each trendline should have at least two confirmed touchpoints. These touches reflect repeated interaction with support and resistance, which helps validate the pattern’s strength. In some cases, a third touchpoint can add further confirmation.
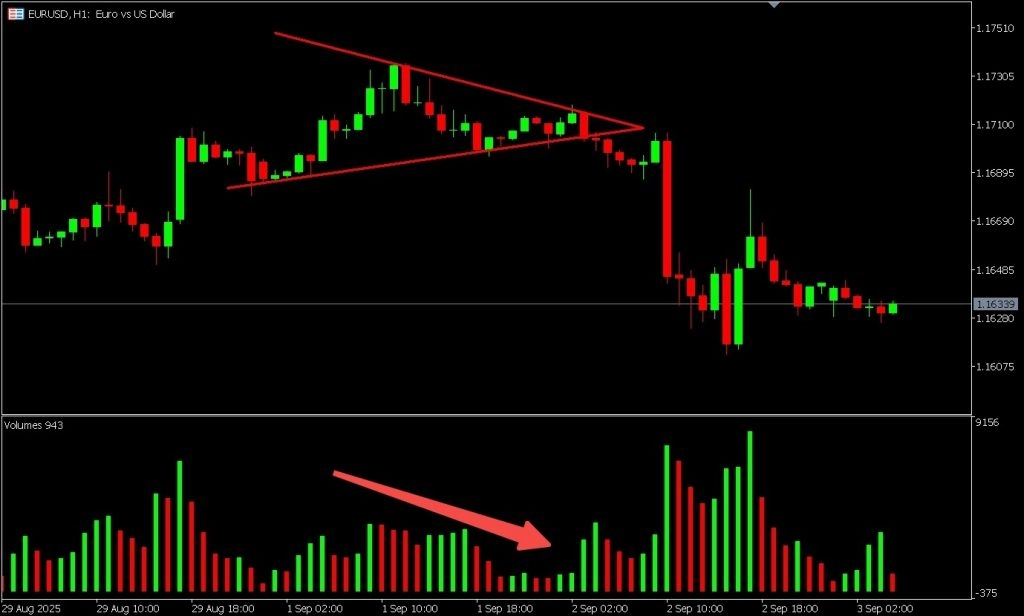
Volume typically decreases as the pattern forms. This reduction in activity reflects indecision in the market, where traders await a clear breakout before re-entering positions. A sudden spike in volume near the breakout point often helps confirm the move.
Symmetrical triangle patterns can form over various timeframes, from a few hours to several weeks. While the trading principles remain the same, traders should adjust their risk and position size according to their usual trading timeframe.
| Feature | Description |
| Prior Trend | Should follow an uptrend or downtrend |
| Upper Trendline | Slopes downward, connecting lower highs |
| Lower Trendline | Slopes upward, connecting higher lows |
| Touchpoints Required | Minimum of two on each trendline |
| Pattern Shape | Triangle formed by converging support and resistance |
| Volume Behavior | Declines during pattern formation, often rises on breakout |
| Timeframes | Seen on intraday, daily, or weekly charts |
| Breakout Timing | Typically occurs between halfway and three-quarters of the distance to the apex |
Key Takeaways
Begin by confirming a prior trend before identifying the triangle. A valid pattern includes two or more lower highs and higher lows forming converging trendlines. Volume typically contracts during formation and expands on breakout. Symmetrical triangles can appear across timeframes, from short-term to long-term charts.
Understanding how symmetrical triangles differ from similar chart patterns can help traders avoid misidentifying setups. While many patterns share visual characteristics, each has unique implications for price movement, trend direction, and breakout behavior. This section compares symmetrical triangles to ascending triangles, descending triangles, pennants, and wedges.
| Pattern | Structure | Bias | Common Breakout Direction |
| Symmetrical Triangle | Converging highs and lows | Neutral | Either, depends on breakout |
| Ascending Triangle | Flat top, rising bottom | Bullish | Upward |
| Descending Triangle | Flat bottom, falling top | Bearish | Downward |
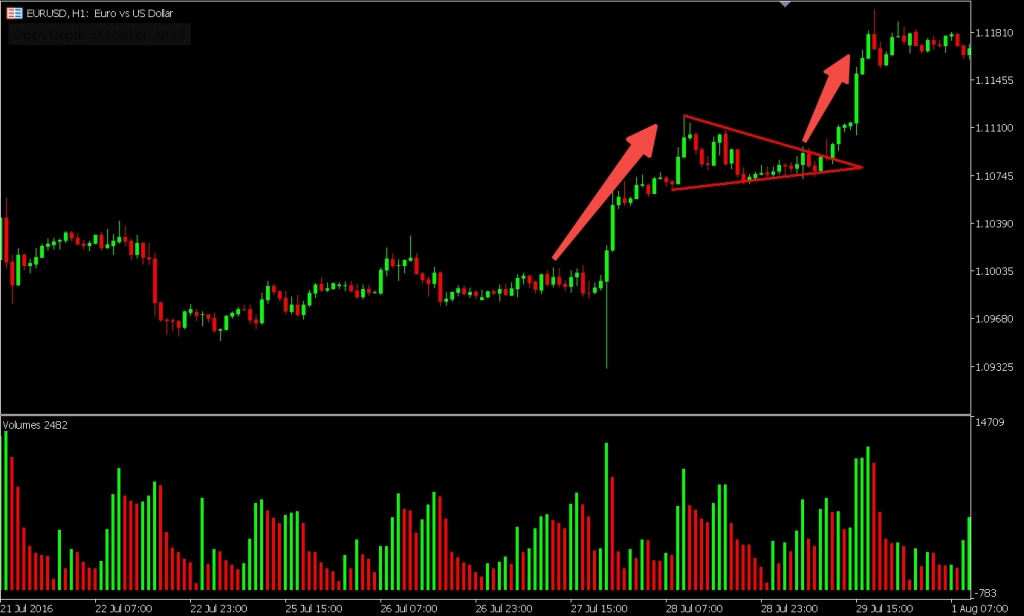
| Pennant | Mini triangle after sharp move | Continuation | In direction of previous move |
| Rising Wedge | Both lines slope up | Bearish | Downward (usually reversal) |
| Falling Wedge | Both lines slope down | Bullish | Upward (usually reversal) |
Key Takeaways
Symmetrical triangles are neutral, while ascending and descending triangles carry directional bias. Pennants resemble small symmetrical triangles but occur after strong price moves. Wedges differ by having both trendlines sloping in the same direction and often signal reversals. Accurate identification helps avoid misinterpreting market signals and improves decision-making.
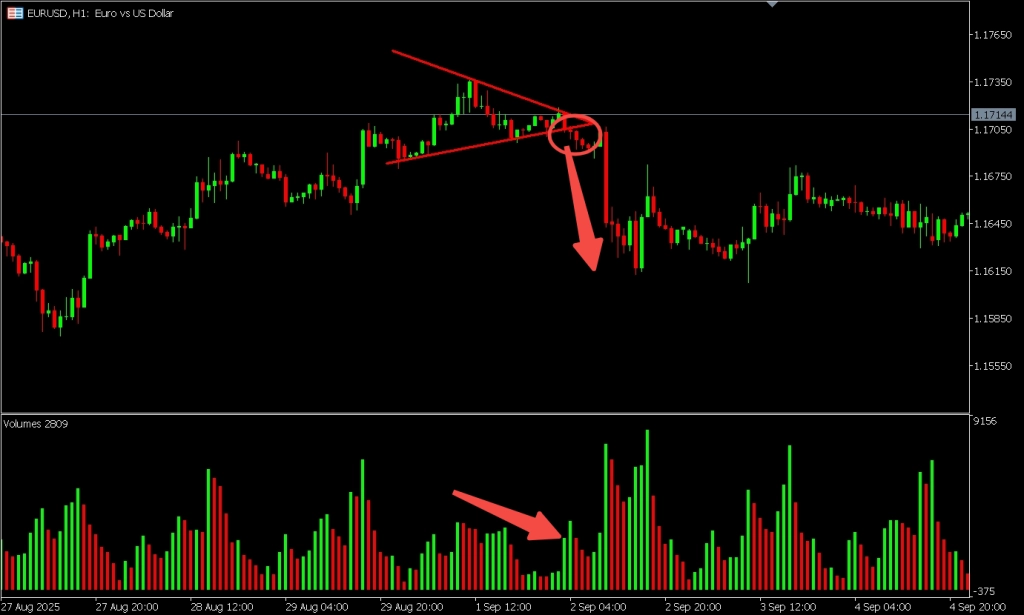
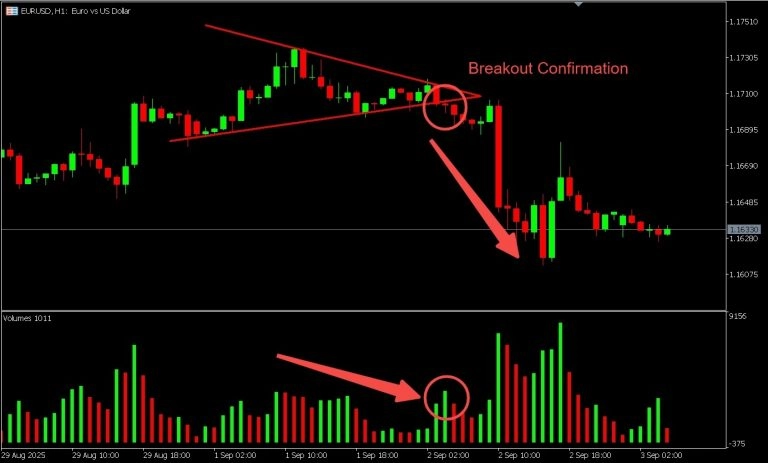
Once a symmetrical triangle pattern nears completion, attention turns to the breakout. Since the pattern reflects market indecision, the breakout is where direction is finally revealed. Confirming this move with clear price action and supporting volume helps reduce the risk of false signals.
As price moves closer to the triangle’s apex, the trading range tightens significantly. This reduced volatility often precedes a breakout. Traders may notice:
Trading volume is a critical element in confirming symmetrical triangle breakouts. During the pattern’s formation, volume tends to decline, reflecting hesitation. A sharp rise in volume at the breakout point indicates increased conviction among market participants and can help validate the move.
A breakout is generally considered valid when:
Traders typically wait for these signals before treating the breakout as confirmed.
While symmetrical triangles are neutral by design, they frequently act as continuation patterns, meaning the breakout moves in the direction of the prior trend. However, breakouts can also signal reversals, especially in changing market conditions. For this reason, the direction should always be confirmed with price and volume, rather than assumed based on trend alone.
Key Takeaways
A breakout often occurs before the price reaches the triangle’s apex. Volume typically decreases during pattern formation and rises at the breakout. A confirmed breakout includes a strong close beyond the trendline with supporting volume. While continuation breakouts are common, reversals are possible, so confirmation is essential.
Symmetrical triangle patterns are frequently used by traders as part of a broader technical analysis strategy. While the pattern itself does not predict direction, it helps highlight moments of consolidation and potential breakout. Once the breakout is confirmed, many traders use well-established methods to manage entries, exits, and risk.
A common technique is to enter a trade after the price closes outside the triangle in the breakout direction. This helps filter out minor price movements that don’t represent genuine momentum.
Some traders prefer to wait for a retest of the broken trendline. This occurs when the price breaks out, pulls back to the trendline, and then continues in the breakout direction. A successful retest can provide an additional layer of confirmation. *The Pattern Site
The most widely used method for estimating price targets is the height projection technique:*Investopedia
This provides a logical estimate of how far price may travel following a valid breakout.
Effective risk management is a key part of any trading strategy. With symmetrical triangles, stop-loss orders are often placed:
This approach helps limit risk in case the breakout fails and price returns inside the pattern.
PU Prime clients can encounter symmetrical triangle patterns across various CFDs, including forex pairs, indices, commodities, and metals. Platforms like MetaTrader 4 (MT4), MetaTrader 5 (MT5), and the PU Prime App support advanced charting and drawing tools that make it easier to identify and react to these patterns.
While symmetrical triangles can provide useful trade setups, it’s important to remember that CFD trading involves speculation on price movements and carries risk. Clients do not own the underlying assets and should always apply sound risk management.
Key Takeaways
Entry points may be based on breakout confirmation or a retest of the trendline. Price targets are often calculated using the height of the triangle projected from the breakout. Stop-loss orders are typically placed just inside the triangle or at a recent swing level. PU Prime platforms support charting tools that help identify symmetrical triangle setups across multiple markets.
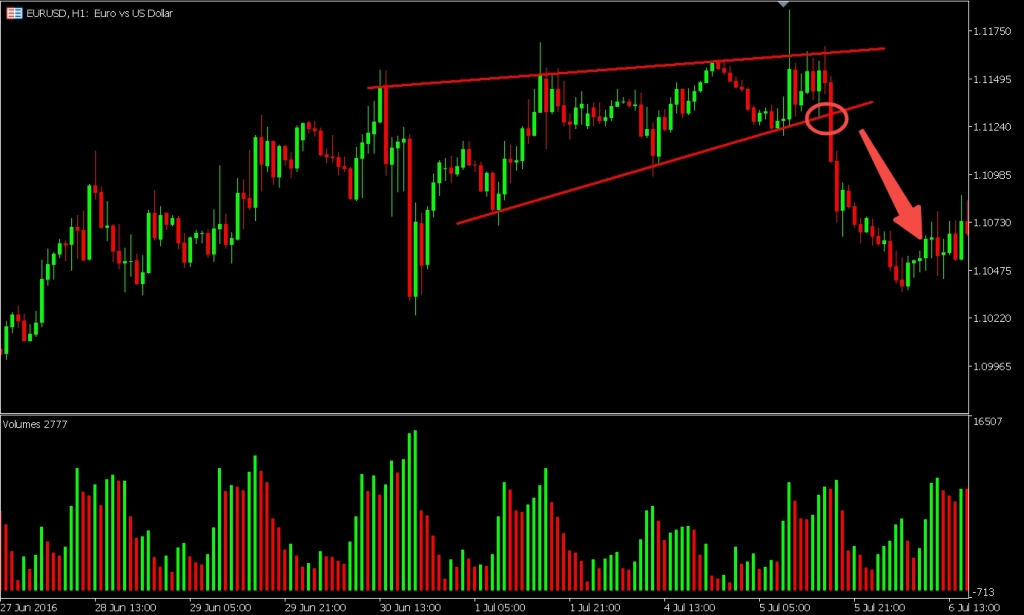
Symmetrical triangle patterns can present valuable trading opportunities, but they also carry risks—particularly when breakouts are not confirmed properly. False breakouts, where price temporarily moves outside the triangle before reversing, can lead to poor entries and unexpected losses. Recognizing common pitfalls and applying disciplined trading habits can help reduce exposure to these outcomes.
A false breakout occurs when the price breaks through one side of the triangle but then fails to continue in that direction, quickly reversing back into the pattern. This can happen when volume is weak or when traders anticipate a breakout too early.
False breakouts often trap traders who enter without proper confirmation, leading to premature positions and increased drawdown risk.
Avoiding these frequent missteps can improve pattern reliability:
While no setup is foolproof, traders often take the following steps to reduce the likelihood of losses:
Key Takeaways
False breakouts can occur when price moves beyond the triangle without strong confirmation. Common mistakes include early entries, neglecting volume, and stop-loss placement errors. Risk can be reduced by waiting for breakout confirmation, following a clear trading plan, and managing position size carefully. PU Prime’s trading platforms offer tools to monitor patterns and set alerts for breakout zones.
The symmetrical triangle pattern highlights market indecision and potential breakout setups. While direction is not guaranteed, confirmed breakouts can offer valuable trading opportunities when combined with volume analysis and risk management.
On platforms like MetaTrader 4, MetaTrader 5, and the PU Prime App, traders can draw trendlines, track volume, and set alerts to monitor pattern development in real time. PU Prime offers access to CFDs across forex, indices, metals, and commodities — all markets where these patterns may appear.
Ready to chart your strategy? Open a PU Prime account and explore advanced charting tools across forex, indices, commodities, and more.
The symmetrical triangle is considered a neutral pattern. It reflects market consolidation and does not suggest a direction until a breakout occurs. While it often acts as a continuation pattern, breakouts can move either upward or downward depending on broader market conditions.
Its reliability depends on context. Patterns that form during strong trends and break out with high volume are generally more dependable. Like all technical tools, the symmetrical triangle should be used alongside other indicators and analysis techniques.
Yes. A common technique is to measure the vertical height of the triangle at its widest point and project that distance from the breakout level. This offers a general estimate of how far the price may move following a breakout.
Momentum and volume indicators can provide additional confirmation. Popular tools include:
This is known as a false breakout. It can occur when volume is weak or if traders act too early. Managing this risk involves waiting for a confirmed close outside the pattern and placing stop-loss orders at sensible levels.
Yes. They can appear in forex, indices, commodities, metals, and shares. PU Prime’s CFD offerings span all these asset classes, making it possible to identify symmetrical triangle patterns across a wide range of instruments.
The duration varies depending on the timeframe and market. On short-term charts, the pattern may form over a few hours or days. On longer-term charts, it may take several weeks to complete.

Traden Sie Forex, Indizes, Metalle und mehr zu branchenweit niedrigen Spreads und mit blitzschneller Ausführung.
Registrieren Sie sich für ein PU Prime Live-Konto mit unserem unkomplizierten Verfahren
Zahlen Sie bequem über verschiedene Kanäle und in verschiedenen Währungen auf Ihr Konto ein
Erhalten Sie Zugang zu Hunderten von Instrumenten zu marktführenden Tradingbedingungen
Handelsplattformen
Lernen
Über PU Prime
Unternehmens


Please note the Website is intended for individuals residing in jurisdictions where accessing the Website is permitted by law.
Please note that PU Prime and its affiliated entities are neither established nor operating in your home jurisdiction.
By clicking the "Acknowledge" button, you confirm that you are entering this website solely based on your initiative and not as a result of any specific marketing outreach. You wish to obtain information from this website which is provided on reverse solicitation in accordance with the laws of your home jurisdiction.
Thank You for Your Acknowledgement!
Ten en cuenta que el sitio web está destinado a personas que residen en jurisdicciones donde el acceso al sitio web está permitido por la ley.
Ten en cuenta que PU Prime y sus entidades afiliadas no están establecidas ni operan en tu jurisdicción de origen.
Al hacer clic en el botón "Aceptar", confirmas que estás ingresando a este sitio web por tu propia iniciativa y no como resultado de ningún esfuerzo de marketing específico. Deseas obtener información de este sitio web que se proporciona mediante solicitud inversa de acuerdo con las leyes de tu jurisdicción de origen.
Thank You for Your Acknowledgement!